At Cardinal Path, we like to preach that all of the Internet is a poll.
In fact, we often say that it’s a better poll than the ones conducted by pollsters because the sample size is so much larger and because topics searched using Google and online content selections are not slanted by the presence of the pollster or the nature of the question.
If a person wants to find something online, it’s because the topic matters to them.
With the upcoming Canadian federal budget, we felt it was an appropriate time to take the temperature of the Canadian population and the political parties vying for its support by examining the news items, search terms and other content that make up online discourse.
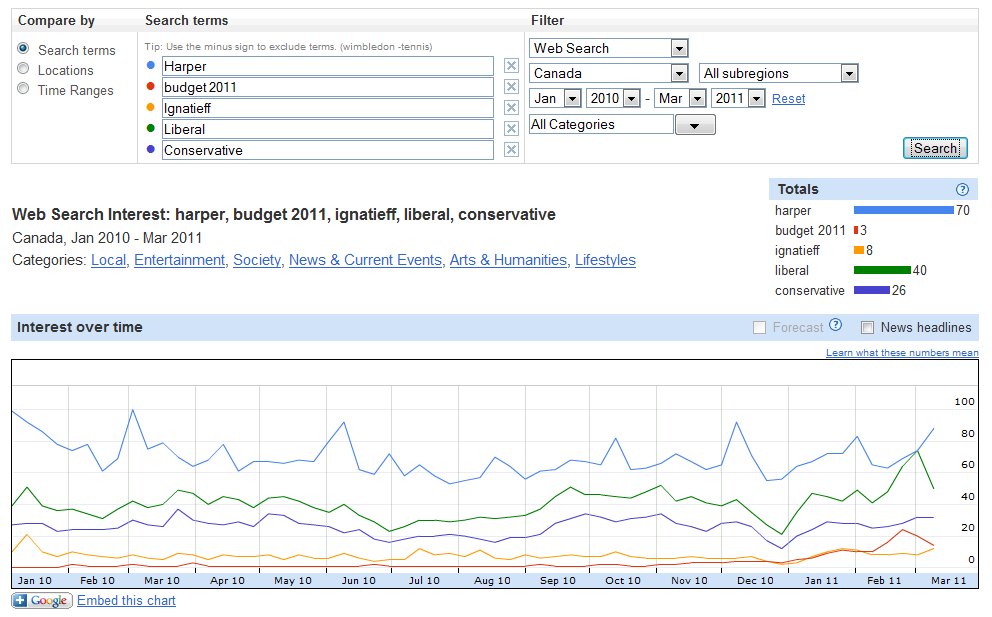
See a higher resolution version of above graph.
The values in the above graph are relative. The highest search quantity is assigned a score of 100 and other scores are set lower (a score of 25 means that content received 25% as many searches as the top search item).
Since January 2010, we can see that the “Harper” brand is dominant, beating even the conservative party brand, as well as “Liberal”, “Ignatieff”, and “federal budget”. For a governing prime minister, this is to be expected. What may be most interesting is the disparity between the Harper brand vs Conservative and Ignatieff brand vs Liberals.
While Harper beats both the Liberal and the Conservative terms, Ignatieff lags behind both his competitor and his own party for searches in the past 14 months.
In terms of overall interest in a term, it appears that Canadians are generally not as interested in the budget as they are in the ongoing affairs of the Liberal and Conservative parties and their leaders.
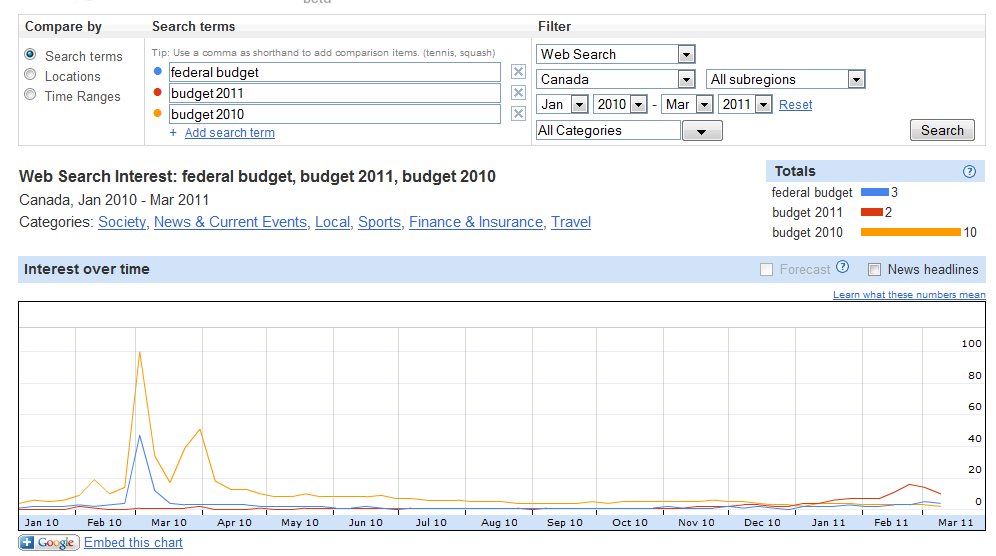
See a higher resolution version of the above graph.
How interested are Canadians in the budget overall? Considering that the budget will be released on March 22, 2011, we’re seeing about the same level of interest (a score of 14) as there was a week before the 2010 budget, which was presented on March 4 of that year.
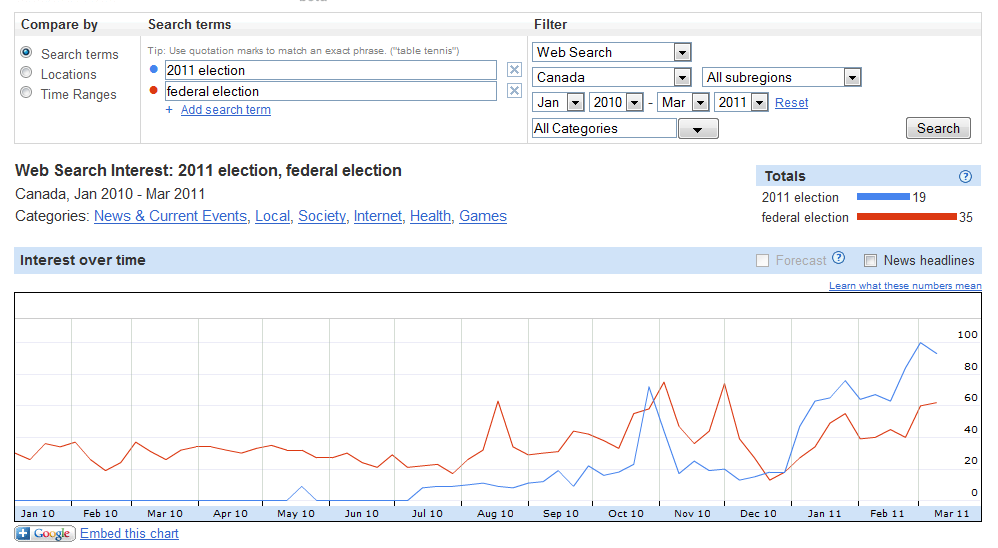
See a higher resolution version of the above graph.
In terms of overall interest in an election, we can see greater overall interest in “federal election” topics than in 2010. For instance, the week of March 14-20, 2010 there was a relative score of 26. In 2011, the week of March 6-12 has a score of 62.
For the term “election 2011”, the week of Feb. 27 to March 5 had the highest searches of the past 14 month and therefore had a score of 100. The week after that, the score dropped to 93. Searches for this term has been growing since January and may increase or decrease depending on whether there is an election. Of course, that’s dependent on the opposition parties’ votes on the budget.
There was also great interest in “election 2011” in October 2010 where the week of Oct. 24-30 had a score of 72.
What does this all mean?
Canada definitely has a touch of election fever right now, and Prime Minister Harper is dominating the discussion. As we approach the budget vote and an election as early as May, it will be interesting to see how these trends change when campaigning begins.
Check back soon for more Canadian election blogs in March and April.


