Back in March, Rand asked the SEO community on Google+ “What are the specific, key metrics you track on an ongoing basis for your site’s SEO health?” That post spun into a larger discussion now with 68 +1’s, 28 shares and 47 comments. The fascinating part of this post was the comments that followed it, which motivated me to write this blog post.
Just a month later, Ian Laurie of Portent wrote one on SEO Analytics, Middle Earth-Style, which again, was a very insightful piece that largely talks about where you should be spending your reporting time. The takeaway I got from each post is this: every business will have their own set of unique SEO success metrics. I could list out the hundreds of metrics and combination of metrics that SEO can monitor, but that wouldn’t be worth your time sipping through it.
Secondly, SEO metrics are meaningless unless you can relate them business goals. While we aim to help with the growth of Organic traffic, aligning that with business objectives is whole separate task that needs to be part of your Key Performance Indicator (KPI) selection.
I’m going to spend a bit of time now walking through five areas that I believe will provide some deep insights in your reporting. If you have any comments or suggestions, I would love it if you left a word or two in the box below this post.
(1) Growth in Brand vs. Non-brand vs. Not Provided Traffic AND Conversions
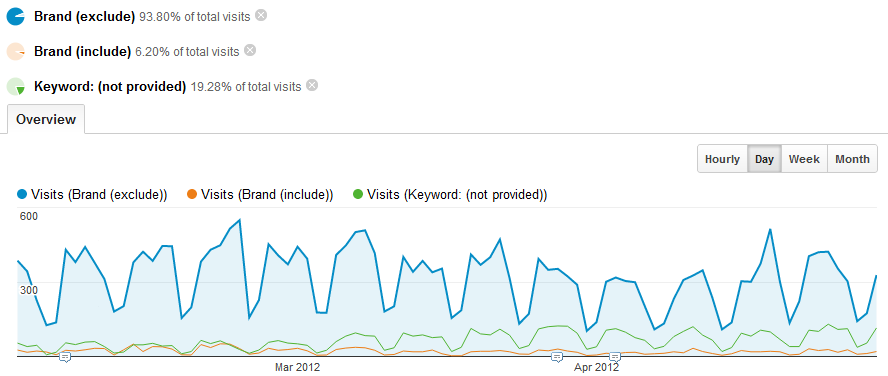
More and more, we see (not provided) growing in the weeds of our keyword data and it doesn’t seem like it will go away anytime soon. So instead of putting all this worry on our shoulders, let’s look add it to our list of keyword buckets. If we create these in Google Analytics, we should get something like this. 
You may even want to use this segment to look at conversions…
 What does this tell us?
- Is my Brand awareness growing? If so, then our Brand search traffic should be growing.
- Are people finding me (those who don’t know me)? If so, then our Non-brand search traffic should be growing.
- Are people performing secure search before coming to my site? If so, tell them to log out and search again =) (joking)
- What type of keywords are trigger more goal conversions?
Where can you find this report?
- Traffic Sources > Sources > Search > Organic
- Turn on your three advanced segments; (1) Brand (2) Non-Brand and (3) Keyword: (not provided)
If you are unsure how to construct these advanced segments, check out Kent’s blog on segmenting keywords in Google Analytics.
Additionally, Ani Lopez wrote an excellent post on how to distribute, proportionally, (not provided) traffic with brand and non-brand traffic. For additional reading, visit this page.
(2) Conversions and Engagement by Keyword Categories
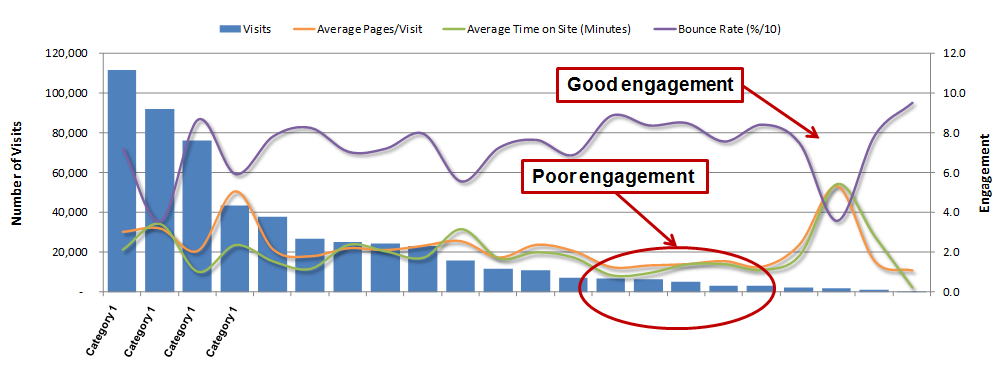
In my last post, I outlined a process for doing keyword research and mentioned the importance of not looking at keywords at an individual level, but to group keywords in categories to determine the relative demand for content themes. When analyzing keywords in your analytics data, you can do the same. By doing a bit of manual categorization and =VLOOKUPs in Excel, you can produce a report that may explain where some of your issues lie in your data. For example, we see that some categories below have a higher engagement than others.  Additionally, with the categorized keywords, you will be able to identify categories whereby a greater volume of them converted.
What does this tell us?
- Poorly engaged organic visits on a keyword level by category
- Identify misalignment of traffic (i.e. Avinash’s example of high bounce rate visits = “I came, I puked, I left”)
- Keyword categories that converted more than others
Where can you find this report?
- You cannot find this report in Google Analytics. You will need to export your organic keywords and categorize them manually.
(3) Conversions Assisted by Organic Search
If you understand how multi-channels work in Google Analytics, then you know that search plays a part in more than one path of the funnel. Thus, it is important to account for everything at the top AND bottom. After all, if you are convincing a higher up that SEO is worth the investment, you should also be educating them on the sales path and other capabilities that web analytics can do these days. In the end, they will know that Search can be attributed to both; a last-touch conversion or an assisted conversion. So what are we talking about here? Multi-channel funnels =)  What does this report tell us?
- Number of assisted conversions whereby they discovered your product/services early on but did not convert until later
Where can you find this report?
- Conversions > Multi-Channel Funnels (Assisted Conversions)
Additional thoughts: It’s too bad at this time Google Analytics’ custom dashboards does not allow us to add widgets for multi-channel reports to get a roll up of assisted and last interaction conversions. I would like to see this feature roll out in the near future. If you want some additional readings on keywords in multi-channel funnel reports, I wrote a blog post that explains in greater detail how you can use custom channel groupings to understand your keywords better.
(4) Last Interaction Conversions from Organic
Last interaction conversions are ones that we’re most familiar with because before the birth of Multi-Channel Funnels, we only relied on the last touch model to derive conclusions. In the end, we know that 3,212 visits converted, and 1,322 assisted a conversion. This means that Search has a combined value of $16,183 instead of $8,030. Would you agree that $16K is a better number to attribute to Search? =)
What does this tell us?
- Number of conversions whereby a visitor acted on something during that organic search visit
- Combining assisted and last interaction conversions paints a better picture for you and for your boss
Where can you find this report?
- Conversions > Multi-Channel Funnels (Assisted Conversions)
(5) # Landing Pages > 1 Visit
Expanding a website’s page index is like growing a franchise business where you’re bound to reach more people. We’re in the era where people, and search engines, value quality content and are looking for something that they’d say “That was cool! I’m going to share it with my friends.” Wouldn’t it be nice to hear that from your visitors? Of course!
What does this report tell us?
- Your active page index; how big is our fish net on the web? The bigger, the better.
Where can you find this?
- Content > Landing Pages (bottom right hand corner, record that number)
![]()
Closing Thoughts
Deciding the “right” metrics to monitor and report on may take more than one attempt to get it right. Your list of KPIs may change over time depending on your business needs as your company matures. The final stage after selecting a set of metrics is to inject it into one easy to understand report. If you recall what we went through today:
- Growth in Brand vs. Non-brand vs. Not Provided Traffic AND Conversions
- Conversions and Engagement by Keyword Categories
- Conversions Assisted by Organic Search
- Last Interaction Conversions from Organic
- # Landing Pages > 1 Visit
Do you include these metrics in your reporting? Are there other metrics worth mentioning? I hope this provides some food for thought when it comes to choosing SEO metrics. Please share any thoughts you may have in the comments below.


