We have now learned how to remove brand related keywords in part one of this blog series, and we can apply this approach to specific audience segments. In the next part of this keyword blog series we will look at how we can do a deeper analysis of vast quantities of keywords (the long tail) – which isn’t easy because this is seriously unstructured data with a semantic spin!
The Natural Step (TNS) is an international organization with offices on several continents. It is important to understand the ‘language of demand’ in the countries and regions in which TNS operates – particularly since the language and needs of visitors from different regions vary greatly. All offices share one large website so isolating the web analytics data for each region and country is key to understanding visitors and clients from the various regions. The keywords entered into Google and other search engines, which ultimately bring visitors to our website, are clues to understanding our website visitors and clients better.
In this example we will look at geographical segments and how we can isolate keywords for cities, countries, regions or continents.
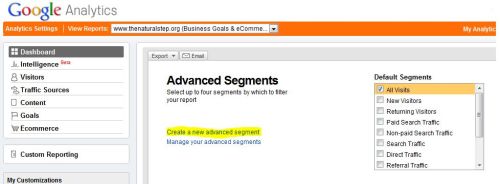
First, create an advanced segment as shown with yellow highlights in the next two images

Then…


Be sure to name the segment and click ‘apply’. Now you should see this segment when you click on advanced segments.

Now the fancy part, check the box for this segment and uncheck the boxes for all other segments. Note the yellow highlight below shows we have deselected the default segment called “All Visits”.

And voila! Now all the data and information in the Google Analytics interface is focused strictly on those visits to the website from Western Europe (or the city, country, region, continent you have used to create your advanced segment).
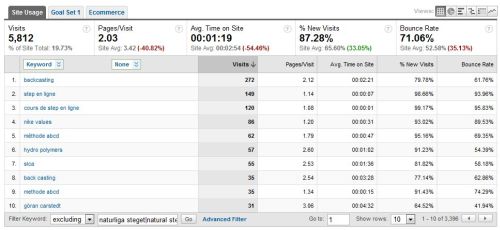
Browse the Google Analytics dashboard and reports to learn more about this group of visitors. Next, let’s look at the keyword report and remove the brand using the inline filter:

Now that we have the topic keywords for visitors to our site from Western Europe, and we have excluded the brand (indicating the visitor already knows our organization), we can compare the bounce rate and time on site for each keyword. What we are looking for are the keywords with a low bounce rate, and a high average time on site, because this shows what keyword searches are attracting an engaged audience – and the percent new visits will help us understand which of these “sticky keywords” are attracting new visitors to our site. Paying attention to these keywords will help us grow a loyal visitor audience base.
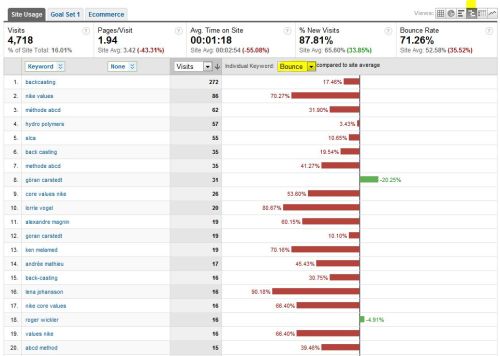
The image below highlights a great comparison report or view for the bounce rate. Remember that red is bad and green is good – and in this case the term ‘hydro polymers’ (item 4) is actually good compared to other keywords!
The site average for the bounce rate is 52.58%(meaning that about half of all visits to the site depart after viewing only one page). For ‘hydro polymers’, of the 57 visits to the site who used this keyword in their Google search, about the same percentage of visits leave after seeing only this one page as the site average.

What we learn here by scrolling down the list of keywords is that it always seems to be names of people that result in lower bounce rate! There it is: proof that your people are your most important asset!


