We help answer questions like this all the time! And with this simple method, you can too.
With WebShare redesign projects, we do more than just build pretty websites. A truly good website is a combination of being aesthetically pleasing, functional and highly measurable. The purpose of the site has to be clearly defined and the results must be tracked, tested and analyzed in order to make informed decisions to better serve its purpose. Testing, measuring, analyzing: This is what we do.
We recently completed development on the new C3 Concerts website (www.c3concerts.com) and have configured some very common additional Google Analytics tracking to provide the necessary insights to make better decisions about the site. After collecting enough data, seeing how effective various design elements are on the site is a snap!

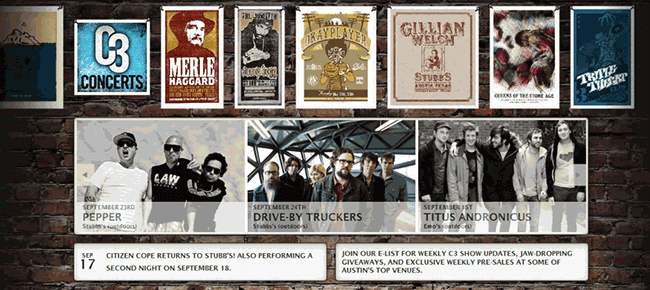
Example: There are two banners on the home page to showcase various events, promotions or news articles. An internal debate exists over the necessity and/or effectiveness of these banners.
Enter WebShare and Google Analytics. In their native state, these banners are simply links to other pages within the website. Clicks on these banners send the user to the expected page and GA records a standard pageview of that resulting page. However, while this shows how many visitors are viewing a particular page, the method doesn’t provide the insights of how I got to that page (other than knowing I came from the home page). For C3 Concerts, we add virtual pageviews to the onclick event of the anchor tag that links to the target page.
Using an organized naming convention for virtual pageviews makes it very easy to see in the Content Drilldown reports:
- A banner was clicked
- Which banner was clicked (1 or 2)
- What type of announcement (event, news, promotion)
- Info about the specific announcement
For example, Banner 1 links to a specific event:
<a onclick="_gaq.push(['_trackPageview', '/vpv/banners/banner1/event/name-of-event']);"
href="event.html" >BANNER</a>
Note the “vpv” that leads it off…by putting all virtual pageviews that we create in this base “folder”, we can easily create profiles in Google Analytics that filter this “fake” data out so as not to throw off our true pageview counts, bounce rates, etc…

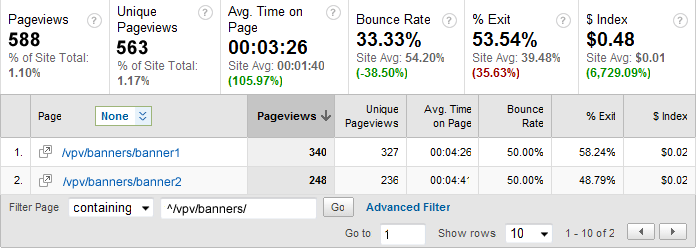
In Google Analytics, a few clicks through the Content Drilldown report provides the answers needed to make decisions:
- How many banners were clicked?
- Which banner was clicked more often?
- How many events, news or promotions were clicked via banners?
- How many click-thrus per promotion?
About C3 Concerts
C3 creates, books, markets, and produces live experiences, concerts, events, and just about anything that makes people stand up and cheer. Among others, C3 produces the Austin City Limits Music Festival, Lollapalooza, as well as more than 800 shows nationwide. In additon, C3 offers representation services and publicity to artist and entertainers.


