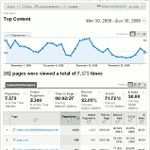
Next up in the series of most useful Google Analytics reports is the Top Content report.
The Top Content report is likely one of the first reports you will be looking at when assessing your website’s performance.
This report gives you the following common per-page metrics:
- Page Views – This is the number of times a page or set of pages has been viewed. Repeat views of a given page or set of pages are counted.
- Unique Page Views – Number of visits during which a given page or set of pages was viewed.
- Time on Page – Average amount of time visitors spent viewing a page or set of pages. This time span can only be calculated if the visitor visits another page on your site.
- Bounce Rate – The percentage of single page visits for a set of pages or a given page.
- % Exit – Percentage of site exits from a page. This can be compared to the average page % Exit.
- $ Index – The average value of a page or set of pages. $ Index=(Ecommerce Revenue + Total Goal Revenue) / page views for the page(s). This metric helps you prioritize the importance or impact of pages on your website. The higher the $ Index value, the more valuable a page is in generating conversions.
This report can be sorted by the different metrics by clicking on the metric headings at the top of each column. By default it is sorted by page views in descending order.
Note: Interesting article on how Google Analytics calculates some of its metrics and how this affects accuracy.
The report should be used to do much more than take the pulse of your website, or act as a counter. It should be used to gain insights into visitor behavior. You can segment and/or filter your data so that we can figure out how different groups of people consume and interact with your website content.
To do this you must first have some basic knowledge about your visitors, and how visitor segments may behave differently. For example, first time visitors vs. repeat visitors, or organic search traffic vs. paid search traffic.
When looking at the data in a segmented way you will likely find that a given group of people makes up a greater portion of traffic than the other. These different groups of people will also have different motivations or intents for their visits and as a result be of different value to your company. So this information can help us figure out how to adapt your content to best satisfy the different segments of people who are viewing certain pages.
On the top content report you can also drill down to get more detailed information by clicking on a page.
Once on the content detail report for a given page you are able to analyze a page in four additional ways:
- Navigational Summary – Discover how visitors arrived at a given page and were they went next.
- Entrance Paths – For a given entrance page discover the next pages viewed and where they ended up.
- Entrance Sources – Top entrance sources per page. i.e. Google, Digg…
- Entrance Keywords – Top entrance keywords per page.
As with the Top Content report you will want to segment these results to see how different user groups are finding/entering your site so that you can prioritizing your marketing efforts to drive more of your most valuable visitors to your best pages.
As time goes on Google makes updates and changes to GA. One of these changes was to remove the ecommerce tab from the Content Detail report (this is the report that you drill down to from the Top Content report). This is too bad, as this report would allow you to analyze and compare the ecommerce conversion rates of different product pages. You could also segment the page by referral source to compare how different traffic sources converted for a given page. We hope that at some point they bring it back.


