Today I want to take you all through one of my favourite Google Analytics custom report/advanced segment combinations. I came up with this a year or so ago while looking for potential blog post topics.
The concept behind it is simple: if people come to your site through a specific keyword, and bounce, then they are either finding content that is irrelevant to them, or they are not finding any further relevant content, beyond what they’re landing on. This opens an opportunity for you to produce new content, to entice these visitors.
This custom report can give you ideas about what to write more about, but more importantly it tells you what kind of content should be included around that content (linked from, etc.) to encourage further reading.
The Custom Report
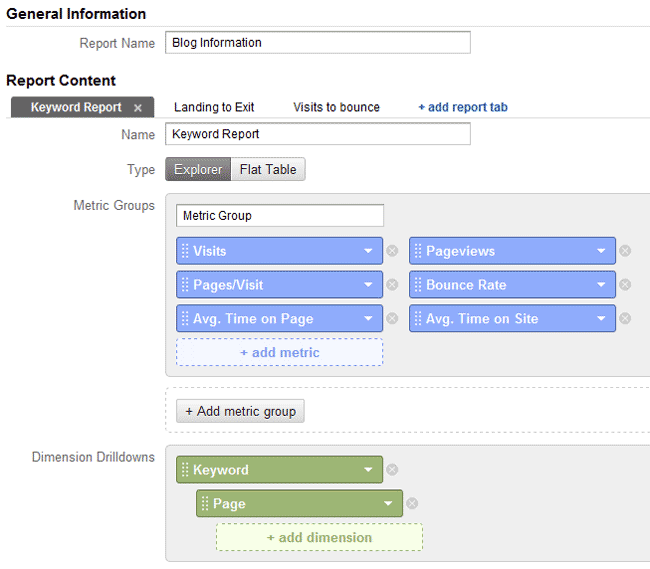
The report is fairly simple to build.
- Add the metrics you want to include. I usually use Visits, Pageviews, Pages/Visit, Bounce Rate, ATOP and ATOS. However, you could get away with visits, Bounce Rate, and ATOP. Optional: You could also include goal conversions. Not crucial to what we’re looking at, but always a good thing to consider.
- Add Keyword as a dimension. I also like to add Page Title as a drill down.

Optional: The Segment
I highly recommend using an advanced segment to remove branded keywords. If you want to know how to do this, please see my post on Regex & Google Analytics. I also recommend using one to filter non-blog traffic.
The Filter
In theory you could set this up as a segment, but I like to use an inline filter for this as it lets you customize what you’re looking at depending on traffic.
First filter out your junk keywords and landing pages.
- Exclude > keyword > matching RegExp > (not set )|(not provided).
Next, take a look at your traffic levels. back in the old day, we could use a weighted sort between pageview and bounce rate, but that feature was taken out in V5 it seems, so instead it’s up to you to use some judgement. Obviously if a keyword is only bringing one or two people to a post, then you don’t want to use it. Figure out your sweet spot (I like to check what the 100th most visited post on the list is, then choose a number just below it, but that will vary depending on your posts), then add an inline filter that:
- Include > visits > greater than > (whatever your number is) (you could use an exclude too, but this is fewer clicks)
Now, you need to determine which bounce rate you want to cap at. This is generally done by checking what your average bounce rate is, then setting based on that. Ours is 66%, so I think I’ll say “don’t list anything with a bounce rate less than 70”. Then sort by bounce rate or visits, your choice, and take a look (I like visits). You can then compare by ATOP/ATOS to determine if they’re actually visiting or just bouncing (though remember that a visitor who leaves on that page counts as 0 time on that page).
In our case, we have that a bunch of users are looking for “web analytics vendor market share” but are bouncing pretty bad (75%) and are spending an average of 15 minutes on the page. Â This is a prime example of something we should write more about (and you can bet we will).
Now, just to make sure, click on the keyword and see what pages those keywords are leading to. This will let you know if users are hitting multiple posts from the same keyword, as well as give you an idea of what your visitors are reading.
Alternatively you can select landing page as a secondary dimension, then do the same process, which will likely give you better information, but I find this method somewhat hard to manage. That said, if you have keywords driving traffic to multiple pages, it may be crucial that you sort by both keyword and landing page.
Now write you post, but don’t forget to go back and link to it from your older posts so that visitors finding that page.
Read about more advanced segments, custom reports and Google Analytics.


