After the horrific episode that took place in Japan on March 11, social media played a significant role in keeping the world up to date with everything that was going on. The medium that had the most traction, and which continues to be a vital asset in this whole relief, is Twitter. Twitter users reacted to the massive quake, which caused a flood of conversations on the web.
For those not directly affected by the quake, the most alarming and long-term impact could be the potential for nuclear radiation to seep into Japanese farmland, and, as a result, tainting food that could be arriving on North American shores.
In response to these concerns, on March 22, both Canada and the United States increased the surveillance of food imports from Japan.
We carefully monitored the topic “food imports” in social media including Twitter, Facebook, and blogs, which led us to the discovery of this explosive social trend. We looked back, from June 2010 to February 2011, and found that there was a consistent trend in Canada with a few spikes here and there. Here is a visualization of the social trend for that timeframe:


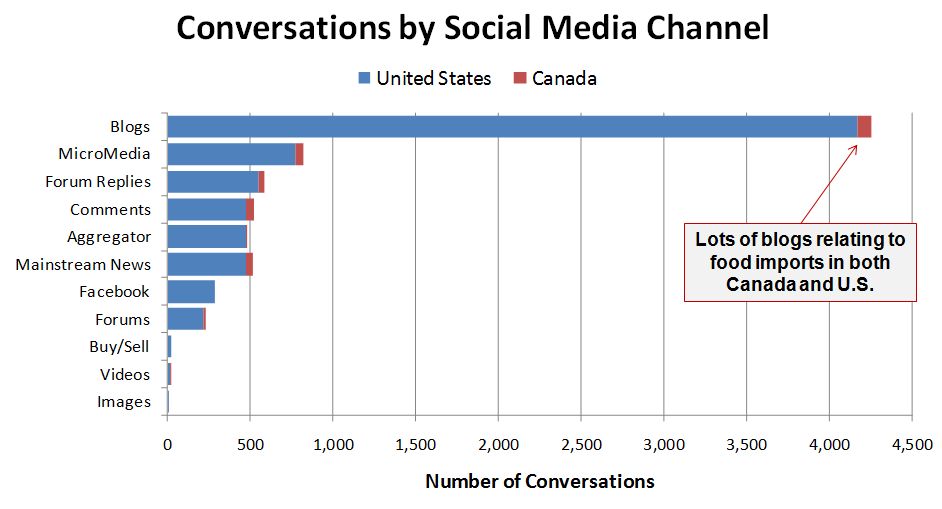
To keep things simple, we chose the top six social media channels by volume and classified the rest under ‘Other’. Clearly we can see that Blogs dominate this conversation over the past 9 months.
Later, we took a look at the volume of conversations in the month of March. Here is the trend we found between the U.S. and Canada from March 1 to 23, a snapshot taken on March 23 at approximately 8:30PM:

The conversation takes off
Notice the scale on the left changed on Figure A and Figure C. A surge of conversations took place after the quake and tsunami hit Japan on March 11. As seen in this graph, the conversation began to pick up on March 23rd when public announcements were given in both the U.S. and Canada about issues relating to food imports.
Now let’s take a look at the volume of conversations trending by social media channels:

Data from Figure B and D show very distinct reactions. Micro Media, which makes up Twitter and FriendsFeed, showed a high level of activity in March, just shy of a thousand or so conversations in a nine month period. Facebook also appears in this graph which was not present in Figure B.
Wow, that’s some interesting stuff! But we felt like we can dive down even deeper and look at the trend for when it was really happening. We managed to capture data for March 22nd to 24th at 7:00AM EST and were able to zoom in on the conversations trending by the hour. Here are the conversations trending by the hour from March 22nd to the 24th:

Majority of the conversation happened between 8:00PM and 8:00AM, a 12 hour timeframe. If you recall, an earlier snapshot was taken at 8:30PM, just 30 minutes after the increased inspection announcement was made in the U.S. So what did this look like across each social media channel?

We can see that the surge of Twitter traffic really took place during this 48 hour timeframe, amounting to roughly 2,300 conversations, or 55% of noise.
What can we conclude?
Big things get people talking. In this social age, words spread at a staggering rate. This event is no different than what we’ve seen happen on March 11th. People will continue to turn to the web to stay updated, but more importantly, they are sharing that information with their network.
The impact of this is immediate, but also limited. Drop off in tweets means that there is no long tail – once something is off of the main feed it is done – making for a very short social media “news cycle”. Therefore, responses need to be quick and organizations need pre-built content strategies so that they can react/engage accordingly.
Additionally it’s worth noting that the US and Canada react the same way, but obviously there’s a giant volume difference reflective of the population.
*Data was collected through Radian6 and reports were produced by PublicInsite staff


