
One of the most common questions we get about GA4 isn’t really about GA4, itself. It’s about why data viewed in the GA4 UI doesn’t match data viewed in BigQuery. There are a handful of reasons why a “discrepancy” between the UI and BigQuery might occur, and in this post, we’ll cover several of the most common ones.
It should go without saying that one possible reason for discrepancies is simply error or misunderstanding in the BigQuery query being used. Leaving that issue aside, here are a few other potential reasons for a mismatch between the UI and BQ, along with some tips for how you can get better matching between the platforms.
The presence of modeled data in the GA4 UI
If you implement Consent Mode and use GA4’s “Blended” reporting identity, GA4 will provide you with modeled data. This is intended to help organizations fill in the gap caused by data that can’t be directly observed due to issues like a lack of visitor consent. However, modeled data is not included in the GA4 BigQuery export.
As a result, modeled data in the GA4 UI can lead to a data discrepancy — specifically a discrepancy in which various volumetric measures are higher in the UI than they are in BQ. If you’re seeing this “symptom” in BQ, check to see whether modeled data is being included in the UI. To validate the presence of modeled data, look for this data quality indicator in a report or an Exploration.
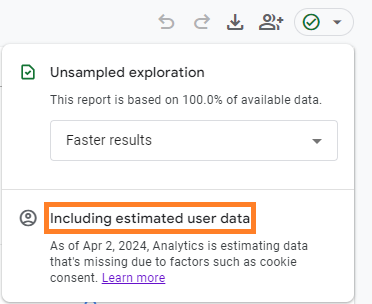
This indicator in the UI will confirm the presence of “estimated” (i.e., modeled) data, as well as the date on which this data began to be included in your UI reports.
If you have modeled data in your data, consider changing your GA4 reporting identity to “Observed” or “Device-Based.” This will remove the modeled data from your dataset, and give you results that better match against BigQuery. Keep in mind that you can switch between reporting identities at any time, without making a permanent change to your data. For example, you can disable modeled data, validate against BigQuery, and then return to included modeled data in the GA4 UI.
Usage of current-day or previous-day data
We recommend not using data from the current day or previous day, when evaluating the consistency of data across the GA4 UI and the BigQuery export. Reports in the UI may not be “at rest,” and hence could result in different values being reported at different points in time. Instead, use a date range for which you can be confident the data in the UI is settled.
Data sampling in the GA4 UI
Your data in BigQuery will never be sampled, so it’s important to rule out sampling in the UI when attempting to match data up between the two systems. If you’re comparing your BigQuery data against a GA4 report, check to see whether the report is sampled. Use the data quality indicator referenced above to understand whether sampling is being used.
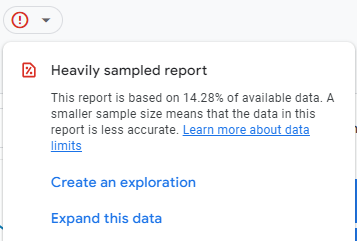
If sampling is a factor, you have several options to mitigate this issue. First, try creating an Exploration, as the data quality indicator may prompt you to do. This will take the same combination of dimensions, metrics, and filters, and “recreate” your report as an Exploration. This is helpful because the sampling threshold for Explorations is 10 times higher than it is for reports (1 billion events per query vs. 100 million events per query).
Second, you can try a variety of techniques to make sampling less likely to occur. For example:
- Choose a shorter date range — instead of 30 days, try 14 days, and so on.
- Consider removing segments and filters, if possible.
- Consider simplifying your query by reducing the number of dimensions included.
Unintended mismatch between BigQuery export fields and UI dimensions
This is likely the most common cause for perceived discrepancies between the UI and BigQuery, and it often manifests when organizations attempt to cross-check traffic source information between the two systems. For example, validating session or conversion volumes across the UI and BQ can lead to discovering a mismatch in your data.
Organizations often use session-scoped dimensions in GA4 to understand marketing performance. This is likely due to the fact that Universal Analytics, GA4’s predecessor, reported on traffic source information in this manner. Common examples of GA4 UI dimensions being used would be “Session source / medium” or “Session default channel group.” This can lead to issues when comparing against data in BQ, because BQ doesn’t currently include session-scoped traffic source dimensions.
The traffic source dimensions currently available in BQ are the “first user” traffic source dimensions, as well as event-scoped traffic source dimensions. The “first user” dimensions contain the values for the first traffic source associated with the user. These values persist from one session to the next, so that organizations can understand how marketing channels first “attracted” users, even if the users don’t convert immediately. Meanwhile, the event-scoped traffic source dimensions are event-specific, which means they don’t necessarily apply to a session as a whole.
As a result, organizations attempting to compare conversion data across the UI and BigQuery are often comparing conversion data that is being attributed in two different ways. This can lead to what seems like major discrepancies in the data — but nothing is necessarily deviating from its expected behavior.
If you want to compare session-level data across the UI and BigQuery, you have options. At a high level, what’s required is to extract the traffic source information from individual events, then do some work to tie that information to the session as a whole. It’s important to note, however, that while this should be helpful, it won’t be a perfect solution. For example, Google’s logic for how individual events are attributed to sessions is not 100% clear, so there can be cases where it’s not obvious which session an event should belong to. Similarly, the fact that GA “batches” events can make it difficult to perfectly reproduce GA’s attribution of events to sessions in BQ.
Recap
If you’re seeing discrepancies between GA4 data in the UI and in BigQuery, consider the following:
- Modeled data can inflate data volumes in the UI relative to BQ
- Current- or same-day data can cause (temporary) issues
- Data sampling in the UI should not be allowed to be a factor
- The BQ fields and UI dimensions you’re using may not match
Hopefully understanding these potential issues will help you feel more confident that you can trust your data whether you’re viewing it in the UI or in BQ.