Where do you go when you want to understand how Google views your site? Whether you are looking for information on how Google crawls and indexes your site, how your landing pages are performing in search results pages or what content is being surfaced on a Google search engine results page, chances are the tool you use is Google Search Console. In addition to a name change (formerly known as Webmaster Tools) there are some other updates and additions you should be aware of. In this article, I’ll walk you through these to ensure you’re set up for success.
| OLD | NEW |
 |  |
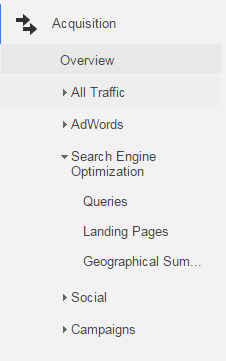
Access to the new reports are through the Acquisition / Search Console menu. The menu name has been changed from Search Engine Optimization to Search Console.
One of the most important is the Search Analytics reports. Located in Search Console, this feature allows content marketers and publishers to gain a better understanding of how visible their content – whether it be App content, mobile content or desktop content – is across search verticals, devices and even countries. While limited, the reports were integrated with Google Analytics. Savvy search marketers would skip the bare bones Google Analytics Search Engine Optimization reports in favor of the more rich data available in Search Console. Google Analytics 360 has changed this with a deeper integration within the search analytics reports of Google Search Console.
What Hasn’t Changed
- We are still limited to data from the previous 90 (Pro tip: Download monthly if you would like to analysis and trend this data over time)
- The Google Analytics API does not download the Search Console data, and you cannot access it via the Google Analytics worksheet plugin
- Some keyword data is not shared – Google does not display some queries “… made a small number of times or containing personal or sensitive information
- Search Console reports cannot be added to the Google Analytics dashboards or custom reports.
This integration makes our job as search optimization practitioners easier. While the data provided isn’t new, having it available in Google Analytics reduces time spent downloading and lets us analyze the data from a native tool. By integrating the analytics metrics and adding reports to compare to such as the Device Type report, the new reports can help web site managers not only better understand how their content is performing in search but be able to answer key questions about their site health and search visibility.
Landing Page Report

The new Landing Page report integrates Google Analytics Acquisition, Behavior and Conversion metrics.
The new landing page report has been expanded to include the familiar Acquisition, Behavior and Conversion metrics. Having Sessions, Bounce Rate, Pages/Session and goals in one interface is especially helpful as previously you would have to use a third party paid tool or download the data and merge with Search Console. Now you can see how Google Analytics data aligns with your Search Analytics data – how impressions and clicks affect engagement and conversion on your site.
Search Console Metrics
- Impressions: The number of times your landing pages appear in a Google Search result.
- Clicks: If a user clicks through from an organic search result, it is recorded as a click
- CTR: Click through rate is the percentage of clicks divided by impressions.
- Average Position: The average rank your page appears at in Google search results.
More secondary dimensions are available. You can now slice and dice your landing page reports with dimensions including device and by country. While Query data is not available as a secondary dimension from the landing page report, you can drill down into each landing page to get an idea of what queries were used to surface your content in a Google Search.

Unfortunately, the Query data set is not integrated with Google Analytics but you can still access various dimensions.
With the Search Console landing pages report, you can now answer these questions directly from Google Analytics:
- How visible are my landing pages in Google search results?
- How do our top pages perform once visitors arrive on the site?
- What is the average position of my landing page?
And when you are ready to take action:
- Look for pages that have strong impression numbers and low clicks – a perfect opportunity to beef up page titles and meta descriptions for your top content.
- Bounce rate high for some key content? Look to improve your on-page content – ensure what is in your page title and meta description aligns with what your visitor expects to find on your landing page.
- Look for pages that have average positions that could be improved. These may be great pages to optimize further – you just may bump up a few positions to take a more visible spot.
Countries
The countries report replaces the Geographical Summary report. Now you can see what countries your content is most visible in, drill down by country to see the top landing pages and then drill down ever further to see what queries surfaced your content in that country. All this and you also get to view the Acquisition, Behavior and Conversion reports in-line with your Search Analytics data.

Secondary dimensions also allow you to view your top countries and landing pages by device category.
The countries report allows you to answer questions such as:
- How does my content perform in searches in (country) India?
- Does my (country) India content drive engagement and/or conversions?
- Is my content competitively positioned in (country) India?
Devices
The Device Category report is fantastic. Not only can you see the same metrics as we accessed in all of the other reports, but you can also compare your desktop vs your mobile vs tablet search visibility and analytics metrics in one view. Here you can also drill down and view your top landing pages or top queries per device category.

Easily switch between queries and landing pages to discover what content resonates on what device.
As search engines adapt to increased mobile usage, this data allows marketers to answer questions such as:
- What content shows up in a mobile search result?
- How does my content perform in search results pages?
- How do mobile visitors engage with my content compared to desktop?
Verify All Properties or Variants
- Be sure to verify all variants of your site – this includes www and nonwww, subdomains, https/http, mobile sites.
- Google’s Search Console can also be used for Apps. Verify your Android app and gain valuable insights into how often your app content displays in Google’s search results.
Queries
The queries report, unlike the previous reports, does not integrate with Google Analytics metrics. Your data is limited to the traditional Impressions, Clicks, CTR and Average Position. Where the report has strengthened is with the secondary dimension. You can now bring in Device Category, Landing Page and Countries to examine where the queries were initiated and what the end result was.

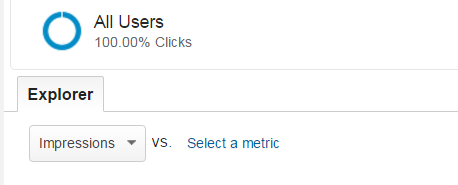
The queries report is the only report that retained the Metric comparison tool. In the queries report you can compare metrics and visualize the result in the trend chart.
When we speak about Queries, it is important to note that this data is not the keyword reports that Google Analytics used to supply. Google is not bringing these back in the Search Console reports. The query reports are based on keyword and phrases that have been used to surface your content in a Google search result. When your content shows in a result, these are reported as Impressions and, when a visitor clicks through to your site, as a click.
While the traditional keyword data is gone, the queries report can help you answer questions such as:
- What queries are bringing visitors to my landing page?
- What position are my top queries showing for?
- How do our branded terms compare to non-branded? What content resonates with branded or non-branded queries?
- What queries show up for searches on mobile devices?
If you’ve skipped the Google Analytics Search Optimization reports previously, it’s now safe to return. The reports all work well together to give you a deep view into how your content is performing in Google Search results and when the visitor clicks through to your site. And if you haven’t set up Google Analytics to work with Search Console, it is a very easy, straightforward process.
How to Integrate
- Ensure you have a verified web set up in Search Console.
- You’ll need owner permissions to associate the site with a Google Analytics property.
- In google Analytics go to the Admin tab and look at the property section.
- Select All Products. If your property is not linked, the option to add it will be under the “unlinked” section.
The addition of these key Search Analytics reports and related functionality that let you examine and compare the content by country, device, query and landing page are tremendously helpful. Bringing the Search Analytics reports to Google Analytics will help marketers make quick analysis and reporting that they can take actionable insights.


