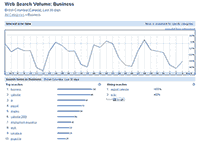
This week I decided to look at what was trending in Canada, initially in my own home province of BC. These were the results:

click for large
This kind of struck me. I know that BC is having a hard time right now, but “EI” ranking as the third most searched term? And the 7th (as employment insurance)? And the 8th (as EI bc)? And “work” as 9th? That’s pretty major.
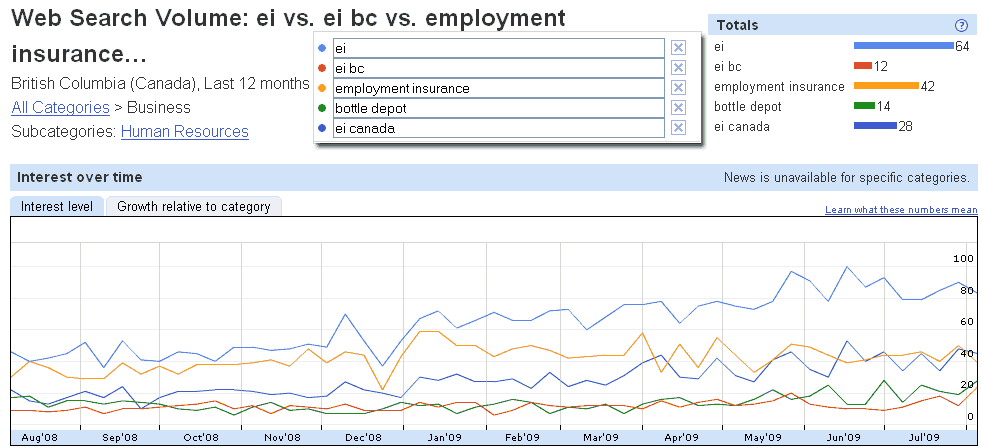
Meanwhile if we go to 90 days we can see that “ei benefits” is up 60%, “Canada ei” up 50% (these have always been on BC’s top 10), and “bottle depot” is up 60% (so either the dumpster divers all just got computers or something has happened in the last 90 days to increase).
If you compare these terms over the last year you can see that most of them are rising, with EI on a steady rise from December ’08 to June.

click for large
Interjection: Google Insight for Search numbers
Woha hold your horses, what do these numbers mean? 100 what?
Google insights are normalized and scaled. This means that we don’t have the actual numbers, but rather the searches normalized by search volume. From Google’s help page:
“All the results in Google Insights for Search are normalized, which means that we’ve divided the sets of data by a common variable to cancel out the variable’s effect on the data. Doing so allows the underlying characteristics of the data sets to be compared. If we didn’t normalize the results and displayed the absolute rankings instead, data from regions generating the most search volume would always be ranked high.”
These numbers are then scaled from 0 to 100, with 100 being the highest number of searches, and the rest a percentage of that.
So instead of thinking about this data as numbers we need to think about them as comparative searches in an area.
BC isn’t alone, Ontario’s 9th and 10th rising subjects in the last 30 days are temp agencies and Spherion (a Canadian job search site); however, it leads with the BC:Alberta:Ontario search index at 100:82:52.
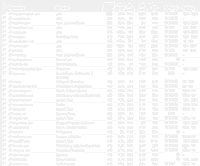
Now there are a number of things that could be causing these numbers. For instance, changes in EI laws could lead to people looking up the new laws. Well, taking a page from Avinash’s book, I threw “ei”, “ei bc”, “employment insurance”, and “ei canada” into Google Ad Planner, searched within Canada, and sorted by comp index (that is “how concentrated your audience is on a specific site relative to internet users within the country you have specified.” [Google Ad Planner Help]) to find what sites these people are visiting. The sites?

click for large
Looks like these people are concentrating on job sites, but also a lot of university sites. Perhaps people looking to go back to school? Or perhaps—and given the concentration of music sites in there I think this is likely—university students looking for jobs.
Now maybe this isn’t related to BC. Could be that the job glut everyone is talking about in Ontario is offsetting our Canada wide statistics. So, I also searched for these terms in Ontario alone, and the sites are drastically different. Once you add BC statistics into the mix the employment sites all jump to the top.
So what can we determine from this data? That people in BC are feeling insecure about their jobs and are looking at job sites. Remember, anything more than this is assumption. This data can only tell you what people are thinking about, not what they are doing. It’s possible that people in secure jobs are researching EI just-in-case, though once when we add in the adplanner data and see the number of job sites being visited then I think its likely (yes, an assumption) that people are looking for jobs.
Epilogue: you lucky Americans
Ad Planner has only half implemented support for Canada, so you can’t sort by, say, demographics. But lets say I was searching for something similar in the US, where demographic data is implemented, and where there is greater over all search data, you could then sort by gender, age, and education (assuming there was enough data, a lot of this might work great in New York, and not at all in Washington).
Why is this useful? Well, beyond advertising, lets say you were out to hire some one 25-45, with at least a bachelor degree. Sort by these demographics with the terms “jobs” “work” and “placement agencies” and then sort by comp index and you have a list of where people in your demographic are looking for work.
Or you can sort by reach (The estimated percent of total internet users (over a specific month) within your defined country who meet the user behavior criteria you specified.) and suddenly you see what other sites these people are visiting. In this case Facebook is #2. Perhaps an idea for where to post job offerings?
Either way, the kind of quick data that Insights for Search provides is fantastic for gaining little insights into what people are thinking about, and what data you might want to target your SEO, PPC spend, and on page advertising towards.
Now excuse me as I go register eibc.ca…


