If you couldn’t make it to Adobe Summit this year – or even if you did but couldn’t cover all of the happenings – here are the Cardinal Path Adobe Summit team’s highlights reel from the show this week.
This last week has been a whirlwind – I made it out to Salt Lake City on Sunday and started my week at the Adobe Summit with the partner briefing Monday. The next three days were spent soaking up as much information as humanly possible in the keynotes and breakout sessions and getting a great feel for all the creative ways companies are utilizing the Adobe Marketing Cloud. The highlight of the entire event was a tie between getting to see Wayne Brady improvise a rap about eVars and the Imagine Dragons concert at Summit Bash.
My kudos to the event planners at Adobe – they put on an incredible conference and I can’t even begin to imagine how much effort and planning must have gone into coordinating over 7,000 people for an entire week. Unfortunately I didn’t make it to ski day – but that did give me some time to jot down a few thoughts on the experience on the plane ride back to Chicago.
Here are a few features I’m most excited to start playing with – some of them we’ll be implementing for our clients very soon.

Contribution Analysis within Anomaly Reports
A little over a year ago, Adobe introduced anomaly detection within the Reports & Analytics tool. The idea behind anomaly detection is to allow you to quickly spot spikes or significant changes in your data. It’s a great direction setter for what you need look at, but then it would usually take hours or even days to dig deeper and figure out what was causing your changes.
With the launch of contribution analysis Adobe takes this a step further and actually runs deep statistical analysis to show us which variables (props, eVars, etc.) are causing the change. The tool will also show you how strong of a contributor each variable is to the spike. From here we can immediately take action by building segments and pushing them into tools like Target and Audience Manager – where we could personalize the experience or retarget specific users.
Of course, there’s a drawback here and the feature isn’t available for everyone. Rather it will only be available for premium customers but hopefully that changes very soon.
For more on the tool check out Adobe’s press release.
Free Form Analysis
Every year, one of the highlights of Summit is what Adobe calls ‘‘Sneaks’’ – their sneak peek at products and features that could potentially become reality. This year the host was Wayne Brady and he absolutely killed it.
One of the major announcements at sneaks was a product called Free Form Analysis. The tool reminds me a lot of Adobe’s Ad Hoc Analysis product but the key difference is that it is browser based rather than a Java Application you run locally. You can break any dimension down by any other dimension and the data query speed is lightning fast. Ad Hoc Analysis is my favorite Adobe product by far, so I’ll be very excited to see what Free Form can do. The tool is going to be released in a public beta and I’m going to start playing with it and will share some more thoughts soon.
Mobile Reality
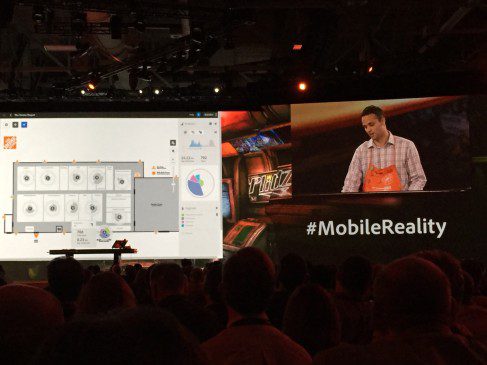
Another very cool feature previewed in sweeps was called Mobile Reality. I doubt I’ll get many chances to use it – but the concept totally blew my mind and is exactly what I’d expect from a session like sneaks.
Mobile Reality uses iBeacons to track in store foot traffic and then feeds that data into a reporting interface where you can do analysis and segmentation. Think of your pathing reports within Analytics, but overlaid on top of your store layout. Adobe then uses iBeacon data to track where users are going within the store. If we see customers visiting two linked sections of the store we can drop them into a segment within the tool and then push personalized product offers directly to their phone using Adobe’s Mobile Services.
Personalized offers like this is exactly what iBeacon is meant to do, but this takes it a step closer to what we’re able to do with browser based data and tools like Analytics, Target and Audience Manager. Customer tracking would need to be enabled through a store’s app – so sample sizes will be small. But the power this starts to give marketers is pretty huge!
Learn more about Adobe’s Mobile Reality.

Some of the other highlights from sneaks included:
- Auto asset tagging within the marketing cloud
- Pixel analysis allows for the tool to learn how you’ve tagged previous assets that are similar to the one that was just uploaded and makes suggestions for you
- Benchmarking
- Industry benchmark reports for your metrics captured in Analytics
- DataTone
- Think Siri, but for the Marketing Cloud
- Natural language processing allows you to ask an app a question about your data, a test, or anything else in the marketing cloud and it will give you the answer
Mobile Optimization is CRITICAL
This one’s kind of a no brainer.
Cardinal Path saw very strong gains in mobile traffic among our clients in 2014 and Adobe echoed that at Summit – telling us that mobile now makes up half of many of their client’s traffic. I can still remember back to when the iPhone came out and mobile represented less than 5% of site visits on your average site – it’s incredible how much content consumption patterns have shifted since then.
So, what does this mean for marketers? Well, if mobile isn’t a major piece of your marketing strategy it should be. In terms of measurement and analytics – it means we need to shift the way we have been thinking. Every analysis should include segmentation of mobile vs. desktop performance. Our site goals and KPIs should be reflective of mobile visitors – in many cases, we may even have mobile specific KPIs. We should be running our A/B testing program across both mobile and desktop, and even only testing on the mobile experience.
Notable Updates for Reports & Analytics
I attended a session with Ben Gaines – the Senior Product Manager for Analytics – where he walked us through some of the newest features coming to the product. Some of my favorites are:
- More variables! You will now have access to 100 eVars and 1,000 events if you’re a Standard customer and 250 eVars and 1,000 events if you’re Premium. But just because you have many more events don’t go and start implementing them all at once. Make sure you’ve got good documentation on what they will do and maintain consistency across your report suites.
- Calendar events get an upgrade. Adobe has added in a new feature to events that allow you to push them to all (or select) users within your organization. Hopefully this will help get more organizations using the calendar events feature to help give in report context to their data
- New plugin for time spent on page. This one is pretty cool – Adobe has a new plugin in Beta that will more accurately calculate the time spent on site. The plugin measures when the tab your site is on is actually in focus within the browser. Traditional time spent is measured as the time that elapses between two server calls, but the problem with this is that if I open a page, switch tabs and then come back after 20 minutes, read the page for five minutes and then go to another page my time spent on page would be recorded as 25 minutes. This new plugin only measures time spent when tab your site is loaded on is actually in focus, so your measurement will be much more representative of how long users are actually spending with the content on the page. You can find more information on the plugin here.
- Calculated metrics in Ad Hoc Analytics. As I mentioned above – Ad Hoc Analytics is my favorite Adobe tool and I probably do 95% of my day to day analysis within it. Over the last year Adobe has seriously bulked up the calculated metrics capabilities within the Ad Hoc. You now have the ability to do excel like calculations directly in the tool and actually derive new metrics based on the data you already have. For me this has already reduced the amount of time I need to complete an analysis – and I’m finding myself needing to export my data into excel much less than I used to. If you haven’t played around with the calculations in Ad Hoc – or the tool in general – check it out.
There were lots of other announcements this year, but overall the Summit seemed to really focus on bringing Adobe’s vision of a fully integrated digital marketing cloud to life. It seemed there were less BIG announcements and a lot of small, but very important announcements, that bring Adobe’s vision MUCH closer to reality, and make all those acquisitions they’ve done over the years play nice together.


