What decisions are we making based on our data if we ignore one of the important factors of the on-line experience – the speed, or otherwise, of our site?
What factors are influencing your visitors as they convert or abandon on your site? We segment visits that nearly convert, by the search terms or ad copy that brought them, by recency, by frequency etc. Yet we know how a shoddy on-line experience can dampen the hottest leads or most ardent shoppers.
This solution does not only support a business case for improvement but increases the accuracy of the insights we can draw because the Latency Data can be correlated with other important interaction-based and visit-based data.
In last week’s post we tabulated (in a Google Spreadsheet) the comparison of Custom Variables and Events. Today, we apply that knowledge and offer the configurable javascript code that makes it all happen.
Let’s first look at the sample reports so we can get a visual grasp on the end result (unless you’d prefer to jump to the Solution Design description
Sample Data
My purpose today is not to prove or disprove that latency adversely impacts the user experience or affects revenue and conversions. It is to describe the a near “drop-in” solution and the use of Custom Variables and Events to create solutions to more complex problems and to display sample reports.
The sample data was generated using test pages to simulate the various scenarios (visits of varying loading times, skipped Entrance or mid-visit pages and different traffic Sources). The actual code was used but load times random values within each of slow, medium and fast ranges overwrote the actual load times. This simulation was done to deliberately favour faster visits to demonstrate what that looks like in the reports.
But wait! There’s some Real Data
All but one of the Reports are from our Google Analytics solution. That solution was based on our original implementation in SiteCatalyst. Here is a custom SiteCatalyst showing real, live Data. Although the data is obfuscated to protect the anonymous, the percentages have been retained:
- 61% of Visitor Subscriptions are contributed by only the fastest 42.6% of all visits.
- That 42.6% of all visits also account for 75% of the site’s revenue.
But here’s a kicker! Those numbers are from the US site. The identical Canadian site shows that around 85% of traffic accounted for the fastest loading visits and a little less than 85% or Revenue!!! Do Canadians have a faster network infrastructure and more patience?
How can we Measure the Cost and Impact of Latency?
Visit Average Load Times
Lets start with the juiciest data
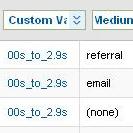
A Visit Average Load Time is the average of the load times of all the pages in a visit. It is reported throughout the visit in a Session Level Custom Variable (SLCV). As with all Custom Variables, the last value in the scope (Session) overwrites all previous values so only the last reported value is retained.
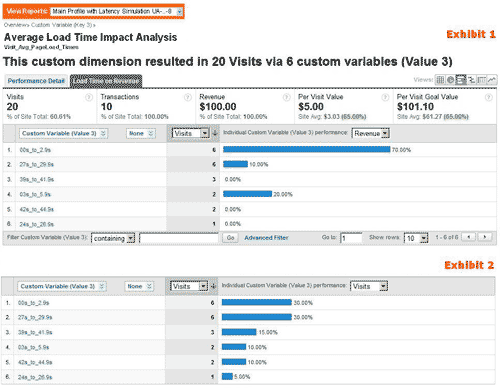
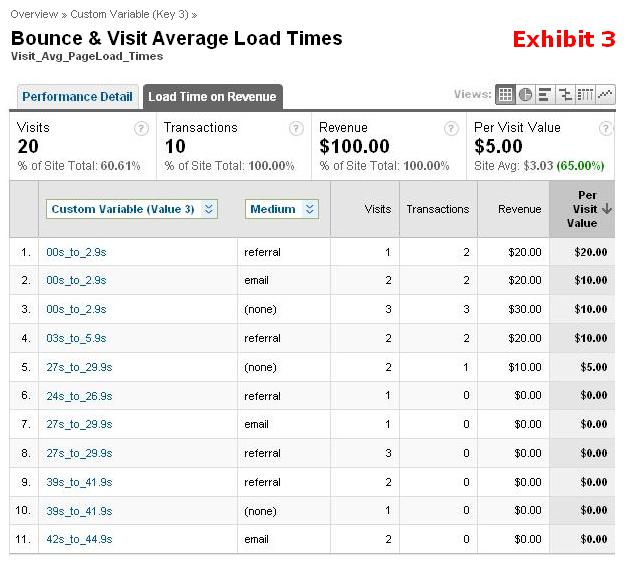
Exhibit 1 first shows a report of the Session Level Custom Report (Slot/Key #3) showing the Average Load Times of all Pages in a Visit, as reported at the end of the visit.
The first Performance Graph shows the load time periods and the percentage of revenue that visits of each load time period contributed.
Values are similar in nature to any custom other Session attribute, such as “Purchaser”, “Member” etc. Here, instead of “Member” or “Subscriber”, the session is described by the Average Load Times of all pages in the visit, as at the end of the visit.
The report shows 70% of total revenue is contributed by visits in the fastest range and 80% by the top two.
If the ranges show similar percentages for revenue as for visits, the report might suggest that Latency does not impact Revenue on this site.
Lets see the distribution of Visits in Exhibit 2. The most lucrative visits accounted for only 30% of all visits. Clearly, the fastest loading visits contributed way more revenue than their “fair share”.
Superficially, at least, it follows that reducing latency to bring more visits up within the fastest ranges is likely to result in increased revenue.
The more the trend holds true across other relevant segments such as Geography and Traffic Sources the greater the likelihood that reduced Latency means increased revenue.
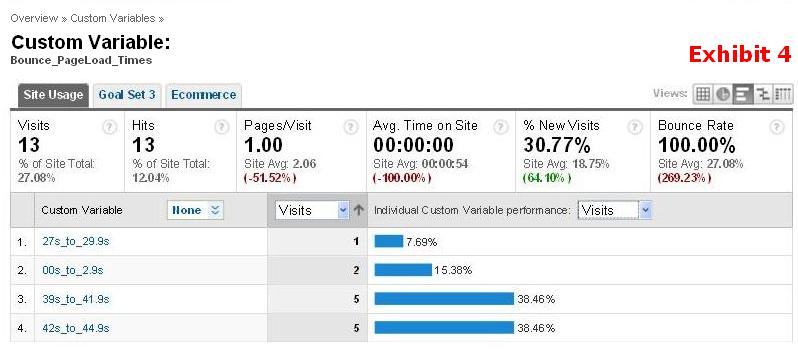
And here is where this solution really pays. Exhibit 3 shows Revenue attributed by Average Load Time and Medium. Medium (or Source or Keywords or Landing Pages, etc) are not always the determining factor. Even when one is, how do you know it to be main issue. Here, 70% of Revenue comes from the fastest visits, regardless of Medium, so where should this site owner be investing for increased revenue?
Conversely, if conversions are not what you’d expect in other segments (eg Branded Search or Paid Search, etc) and optimization efforts are not bearing fruit, measuring PLL may explain things.
Bounced Visit Load Times
There are 2 ways of tracking Load Times of Bounced Pages. Both are in the main profile and neither use Events. Here’s one method for now.
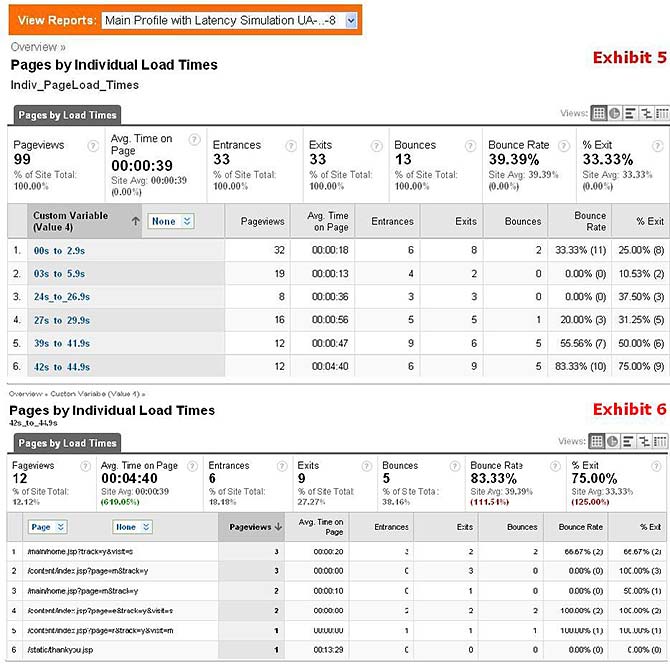
Exhibit 4 shows what the report looks like when the slowest Landing Page load times account for the greatest percentage bounced visits.
The same variable (Session Level, here using Slot 3) is used for both Bounced and Visit Average Load times. On the first page of a visit, the value is submitted with a key “Bounce_PageLoad_Times”. If there are not other pages, that Key and Value remain.
Individual Page Load Times – Page Level Custom Variable
Exhibits 5 & 6 show the Individual Page Load Times of the Pages on the site. Unlike Visit Average Load Times, these are Page Level Custom Variables and can therefore be broken down by Page as shown in Exhibit 6
Exhibit 6 identifies the actual pages that loaded within 42 to 44.9 seconds, the worst on the site, and which ones bounced.
And that’s the 2nd way to report Bounce Pages Load Times. Exhibit 5 shows the Bounce Rates by Time Range while Exhibit 7 shows the Bounce Rates of pages when they loaded within the 42 to 44.9 second time range.
Skipped Entrance and Mid-Visit Pages.
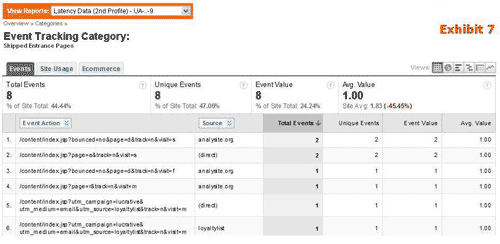
Exhibit 7 lists all actual Entrance Pages that were skipped and not recorded as Pages Views. It also shows the Sources that GA recorded for their visits. Comparing the Skipped Sources to the Skipped Entrance Pages above, we see in rows 5 & 6 that campaign data was lost. In row 5, the visit was attributed as a Direct visit while in row 6 the visitor returned via the same campaign as before (this time!).
The Event Label is used to capture the Referral Path that lead to the visit begun by a skipped Entrance Page. Exhibit 8 shows those Referral Paths matched with the actual Medium of the visit. Rows 3 and 4 show missed Mediums-their referral paths indicate both were referred rather than from an email campaign or direct.
Placing code at the top of the page (hopefully it’s the Async snippets) will deal with skipped tracking. Then the problem is, and the solution identifies visitors not seeing your content or experiencing your site as you expect.
Tracking Skipped Mid-Visit Pages is almost identical to Entrance pages except that the Event value records the number of skipped pages before the one that was recorded. The number should always record at least 1 so the metric to watch is the Average Value. Sorting descending on Average Value will bring pages to the top that more typically followed a series of skipped pages. This suggests either a problem with the GA tracking on those pages (but not with the initial snapshot), a slow section of the site or a section with which your visitors are very familiar.
The other numbers to watch are the differences between Total and Unique Events. The greater the gap, the more frequently such pages are being skipped.
Solution Design Described
The solution comprised of two parts:
- Page Load Latency, measuring both Individual Page Load Times and Visit Averages
- Visitor-skipped Pages – both Entrance and Mid-visit
Tracking code implemented at the top of the page will deal with skipped tracking but we are talking of visitors skipping pages and ads and products and other messages. The code for this implementation currently uses the “Legacy” Code but will be converted to use async code. It will still track whether users have skipped pages.
The common features between the two parts are:
- A possible cause of Skipped pages is familiar and/or impatient visitors clicking through slow loading pages
- Tracking both Load Times and Skipped Pages requires that a snapshot be taken as soon as possible after a page begins loading and reading the snapshot once loading is complete.
While they are related, one does not have to use the two solutions together.
Relating the general strengths and weakness of CVs and Events tabulated in my previous post to our specific problem:
Events:
- are a no-no on entrance pages to report non-interaction events such as load times into our primary profile. Such Events corrupt bounce measurement; CV’s do not.
- report longer data items like skipped page and with more depth for use with referral URLs; CV’s cannot
- have no attribution but are simply associated equally and indiscriminately with other interactions (Page views, transactions, goals, searches etc) in a visit, regardless of sequence.
- are sent alone and so are not correlated with other interactions. They cannot be related to (aka “broken down by”) other interaction level dimensions such as Pages.
Custom Variables have their own set of strengths, weaknesses and one interesting quirk:
- Page Level CVs can be related to Pages and Session Level to Goals and Transactions.
- The quirk with CV’s is that the last name and value of a CV overwrites all previous names and values within the same slot and the same or lesser scope. Since a Session Level CV applies to the entire visit, it is perfect for getting a single Visit-Avg Page Load Time for the entire visit. Events would accumulate multiple values throughout the visit and associate themselves with all Transactions, rendering the measurement meaningless.
The PLL and Skipped pages fit nicely within all these attributes and quirks:
- Events are clearly loners. Their reports need to be interpreted knowing that their is not connection between and the interactions reported with them. In contrast with interactions, Events are associated with their visits and so, all visit level metrics make total sense.
- Skipped Pages can be reported using events since they to are not reported with pages and other interactions (they skipped tracking!).
- They cannot be reported using CV’s because they are far too short and they are reported encoded!!
- They also don’t have the depth to drill down one more level to the referring path of Skipped Entrance pages.
- Unfortunately, Skipped Entrance pages would have to be reported on the first reported page of the visit, which would corrupt bounce rates. This is catered for in the code by rerporting it to a second Web Property ID (not just another profile, since events cannot be reliably filtered)
- Skipped Entrance Pages is the only tracking requiring a second Web Property in your GA account. It is also the only tracking data that is not sent to your Main Profile (ours is called “Main Profile with Latency Simulation UA..-8”. In our simulation our 2nd Web Property is “Latency Data (2nd Profile)-UA-..9”
Configuring Profiles
The easiest configuration is:
- Use the Main Profiles for all but Skipped Entrance Page Reporting. The only reservation is if you don’t have 2 spare slots for the variables.
- Create a 2nd, new, Web Property Account. Its profiles will receive all the data from the solution and any other data sent to the Main profiles other than custom code (Ecommerce tracking, events, visitor classification, etc). Name these Profiles appropriately (e.g. “Latency Data Profile”)
- Other Aspects of the Configuration
- The beauty of the solution is that all the PLL data is sent to your Main profile where it can be related to revenues, bounce rates, etc.
- The Code sends all data into both the main and the 2nd profile except for reports of skipped landing pages and lost traffic sources (as Events)
- While the code is easily configurable to use its own or fewer profiles, either not having other custom data (notably eCommerce) or adjusting existing eCommerce code to send the data to additional Web Property accounts may not be options.
*Getting the Code and Implemetation Sheet
We are making the code available upon request. Leave a comment in the code requesting it, if you are happy with the following:
- Respect attribution comments in the code.
- Provide reports in confidence, including revenue, based on the resulting data. We’d be happy to sign an NDA.
If users of the code are interested, we will gladly do a joint case study for submission to Google for posting on their blog.
Brian Katz – Analytics – VKI
