 Keyword analysis is important because it helps you to understand your online audience(s). This includes: What are your visitors asking for? What is the language of demand? How does this demand change over time?
This blog will explain how to conduct keyword analysis using Google Analytics to understand how features like segmentation can be used to provide greater keyword insights. It will also examine some of the challenges of keyword analysis, and provide real examples of how to get through these challenges!
Why Do Keyword Analysis?
If you get keyword analysis right, then you will have a better understanding of your audience, and you will be better equipped to create compelling content and value propositions in your business. This is known as ‘client-centredness’ – putting the client at the centre of everything you do!
Keyword analysis also means you will gain the intelligence that helps you grow your audiences and increase visitor loyalty. Those who understand keywords will succeed and prosper online, while those who do not risk becoming increasingly irrelevant to audiences and clients.
Keyword Alignment – The Search Engine Results Page
The first thing to know about keywords is that when people enter a search term into Google, your website will only appear on the search engine results page (SERP) if the Google search algorithm calculates that your content will meet the searcher’s needs.
Alignment between the search term and the words on your website is critical – along with all the standard search engine optimization (SEO) details. When you write content, you must think about what words your target audience will be using when looking for your services, products, or information.
If you research the thousands of searches in Google related to your organization, certain keyword patterns will emerge. You can use tools such as Google Trends, or the Google Adwords Keyword Tool to get this information.
Paid Search Keywords and Google Analytics
The second thing to know is: Even if your content is not perfectly aligned with the search terms of potential visitors who you want to attract to your site, you can simply “buy” the search keywords using a system like Google Adwords. When a Google search term matches a keyword you have purchased, then your paid advertisement will appear on the SERP on the right hand side – these are paid keywords.
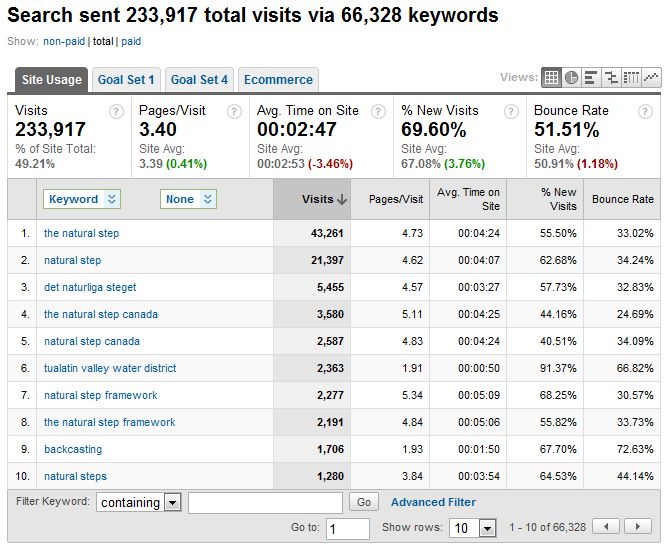
The Google Analytics keyword report, shown in the images below, allows you to choose which group of keywords to look at in the report: “non-paid | total | paid”. So you can segment the report to look at only the non-paid ‘organic search’ keywords, for example. Although Google is the largest search engine this report will also include search keywords from Bing, Yahoo, Ask!, and other search engines.
Keyword Analysis is Hard
The third thing to know about keywords is that they are notoriously difficult to analyze! Why? Because there can be a huge variety of search terms entered in the “wild”. And, because this is unstructured data, mining it for insights is time consuming and difficult – but the rewards of doing this analysis makes it very worthwhile. Luckily, Google Analytics allows you to quickly drill into the “long tail” with amazing speed and precision!
Keyword Analysis Example – Overcoming Brand Noise
Let’s take a look at the keywords for Natural Step Canada, to get an idea of what the data looks like and how you can use Google Analytics to help slice and dice the data in order to understand your audience better.
Once you are logged in to Google Analytics and looking at the dashboard, select the “Traffic Sources” report from the main menu, and select the ‘Keywords’ report from the sub-menu. As with the image below, what you will probably notice that the brand of you organization is pervasive. Brand may include your organization’s name or acronym, or even the URL. When people search for your brand it means they already ‘know’ you – they are searching for your organization specifically in Google – and you should rightly come up in the SERP!

Three things you will want to know are:
- The percentage of all site visits that are brand related – and this may be a key performance indicator you want to track over time!
- What are the keywords associated with your brand that people use?
- What are all the other keywords people are using to find you that ARE NOT brand related?
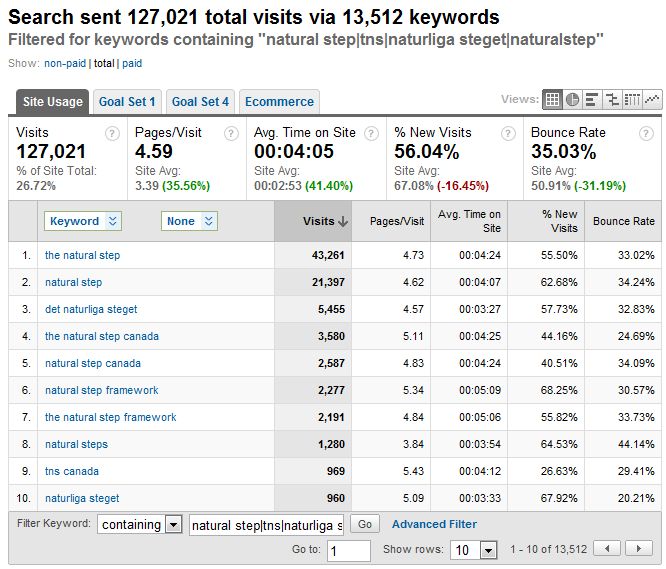
To find the percentage of search that is brand related simply use the inline search feature and enter in the fewest possible letters that indicate a brand search – here I have used “Natural step” and “TNS” and the Swedish variation of the brand separated by vertical slashes to indicate a Boolean “OR” statment.
In this example, we see that about 27% of all visits to the site have demonstrated that the visitor knows the brand, and that there are 13,512 variations of the brand showing up in visits from search engines, for a total of 127,021 visits.
Also note that the Pages/Visit, the Average Time on Site and the Bounce Rate all show higher than average audience engagement and that the percent New Visits is lower than site average. This makes sense because these visitors already know the product—based on the use of the brand in their keyword search term—and they may already know what they are looking for from us, so they are likely repeat visitors.

You can dig deeper into these keywords to understand the dominant brand variants – again, the inline filter will quickly tell you the percent of visits using only “TNS” compare to those searching for “The Natural Step” or “Natural Step”, or “Naturliga Steget” each with different Pages/Visit, Average Time on site and Bounce Rate, to show which variations carry the most weight.
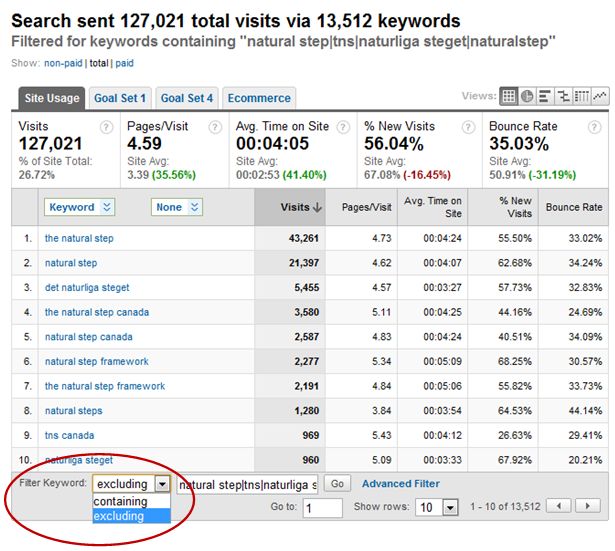
Conversely, to see the keywords that are not brand related, simple exclude your brand keywords using the drop down (as shown below in the red circle). What remains is the meat of your keywords, because they represent the thousands of visitors who may not already know the brand or your organization, but who ARE interested in your existing content! These are the visits that you have earned based on the merit of your online content. This is the space where you can compete to grow your audiences and get a clear idea of what content people are looking for.

Finally, if you conduct keyword analysis and let this information inform or direct your content development, you will steer your site towards larger traffic volumes, and more engaged visitors.
In an upcoming blog, we will examine how advanced segments can be used in conjunction with keyword analysis to help understand niche audience groups. We will also demonstrate how you can measure keyword ‘trending’ in a few simple steps – to help you build out new content quickly in response to changing demands.
Leave a comment on this blog if you have a specific question you would like answered regarding keyword analysis.
PublicInsite Web Analytics Inc.
Google Analytics Certified Partner
Contact us to learn more about what Cardinal Path can do for you.


