
By now, most organizations have transitioned to Google Analytics (GA4), marking a fundamental shift in how we collect, analyze, and interpret user data. Unlike Universal Analytics (UA), GA4 operates on an event-based model, offering a more flexible and future-proof approach to cross-platform tracking. With the migration behind us, it’s crucial to revisit the GA4 data model, ensuring your analytics setup is optimized to drive meaningful insights and business decisions.
GA4’s Event-based tracking
Unlike its predecessor, GA4 uses an event-based data model, which offers several advantages in terms of data collection, analysis, and reporting.
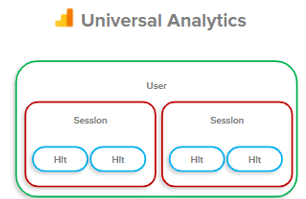
The UA data model categorized data points into one of four scopes that followed a strict hierarchical structure. As a result, data from various scopes not be easily presented or analyzed in the same report.
In contrast, the GA4 model categorizes all interactions as an event, thus providing more flexibility. These events include traditional sessions, pageviews, clicks, and transactions, as well as custom events that can be defined based on specific needs. Each event can be configured to include multiple parameters, which provide additional context.
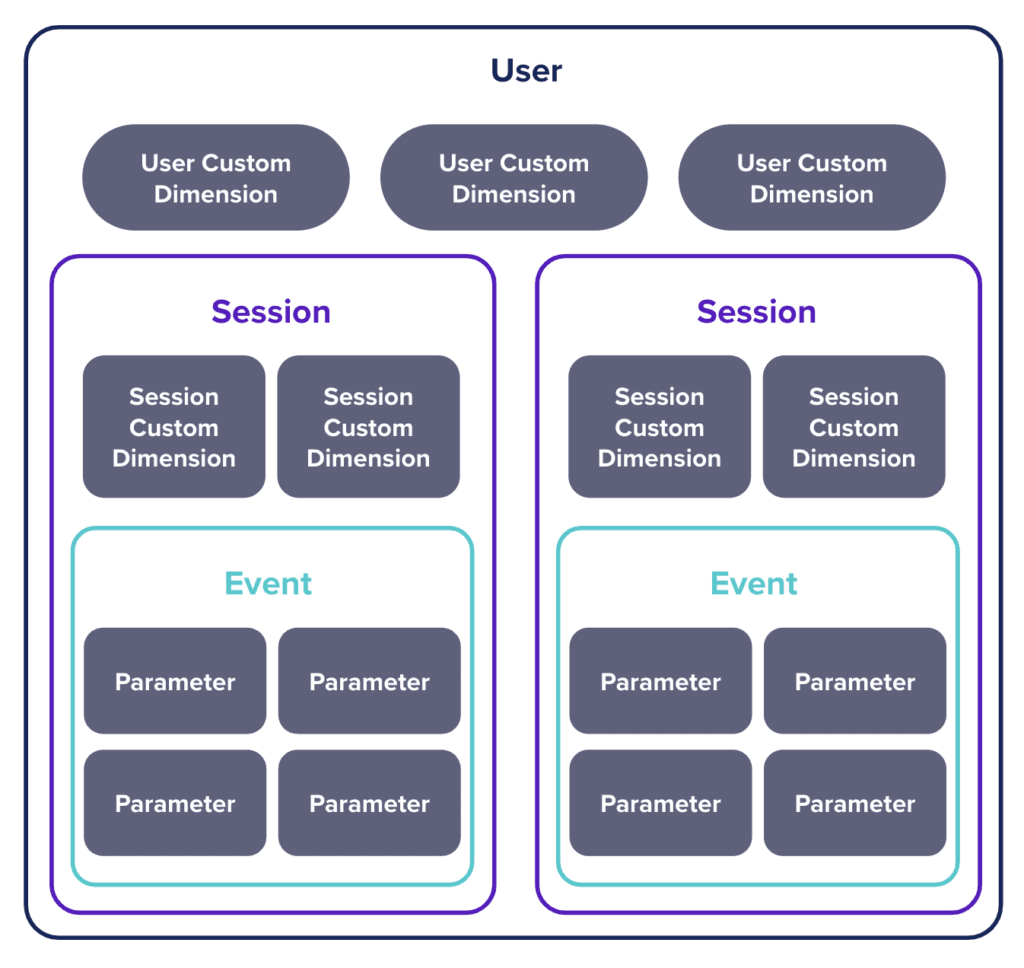
With this data model, GA4 is still able to simulate and provide the intuitive hierarchy offered by UA’s structure, this time without the older model’s rigidness. For example, a session is determined by a “session_start” event, whose parameters include session ID (called “ga_sessionid”) and session number (called “ga_session_number). GA4’s data model is hinged on event-based tracking and sessions are now tracked in the form of a specific event but clicks and interactions made within a session are tracked as events that can still roll-up to the session within which the clicks and interactions were performed. Furthermore, all sessions and interactions triggered by a user can still roll-up to the user that triggered these events. As a result, GA4 is not bound by UA’s hierarchy, but is able to provide such when necessary.
GA4’s data model now allows some components from formerly different scopes to be analyzed together. For instance, UA’s model did not enable the combination of Event Count (an event-scoped metric) with User Gender (a user-scoped dimension). As a result, complex steps were needed in order to analyze events triggered by different user groups, like the number of click events per gender. In contrast, GA4’s data model allows such analysis with ease, thus providing stronger analysis capabilities.
GA4’s User-centric approach
Another key difference in GA4’s data model, which is a consequence of its Event-based tracking, is its User-centric approach.
The UA data model was primarily session-based, where sessions served as the foundation of all tracking, and interactions were grouped into sessions within which the interactions were made. As a result, interactions performed by a single user across distinct sessions could not be easily analyzed together, thus providing a limited, fragmented understanding of user behavior. In contrast, a single user’s interactions are treated as individual events in GA4 and are no longer grouped into the sessions within which the interactions were made. In addition to this, GA4’s data model now enables tracking of both web and app data in just one GA4 property. This is achieved with Unique User ID’s that are assigned when a user logs into a Google account on an app or website. These changes demonstrate how GA4’s model recognizes that a user’s journey goes beyond just one session and beyond just one platform. GA4’s shift towards event-based tracking and its use of Unique User ID’s for cross-platform analysis has yielded a structure that is unbound by UA’s session-based model, thus providing a user-centric approach. As a result, GA4 enables analysis of interactions made by a user, regardless of the session and platform within which the interactions were made. This provides a more comprehensive view and a clearer understanding of user behavior across multiple sessions, devices and platforms.
Conclusion
The transition to Google Analytics 4 (GA4) marked a significant evolution in how we track and analyze user interactions. With its event-based data model, GA4 moves beyond the rigid session-based structure of Universal Analytics (UA), allowing for greater flexibility, cross-platform tracking, and deeper user insights.
Now is the time to fine-tune your GA4 setup and ensure you’re capturing the data that truly matters to your business. Whether it’s customizing event tracking, refining conversion goals, or unlocking cross-device insights, GA4 provides the tools to get a clearer, more complete picture of user behavior. The key is to adapt your analytics strategy, so your data works for you—not the other way around.
As GA4 continues to evolve, staying ahead means regularly reviewing your setup, testing new features, and making sure your tracking aligns with your business goals. The migration may be done, but the opportunity to maximize insights and make smarter decisions with GA4 is just getting started.
Connect with us to ensure you are getting the most out of your Google Analytics setup.