Advanced segments also provide some really cool opportunities to understand how our mobile device audiences are using our site. To learn more, select “advanced segments” from the top right of your Google Analytics dashboard (circled in red below). Next, under the default segments, select mobile visits (circled in red), and de-select “all visits” at the top of this list. Finally, hit the “apply” button on the bottom right, and presto! Now all the information in the interface and all the reports are for mobile only visits.

An image of the Google Analytics interface showing the location of advanced segments on the dashboard.
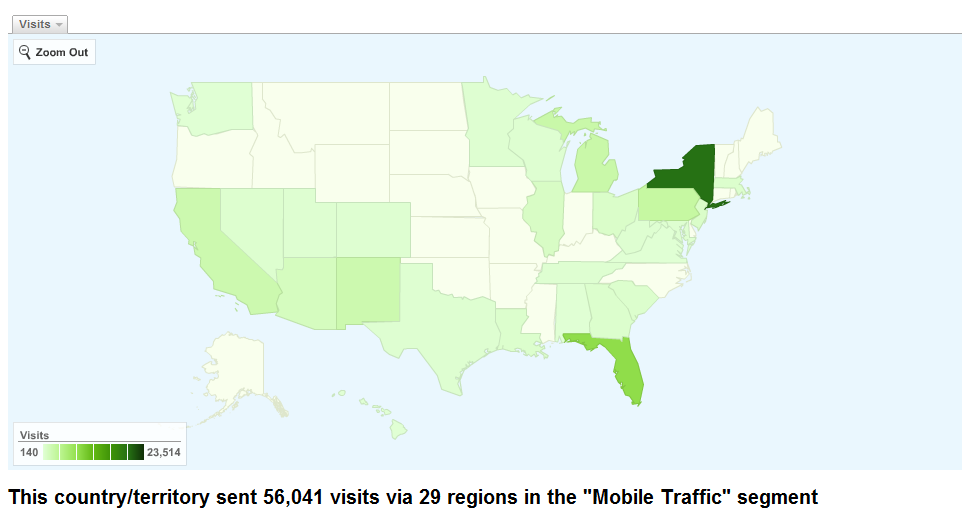
The example below shows the geographical overlay report, and this allows us to see the regions, and cities for visitors to our site using mobile devices. There are tons of other good reports besides this one in Google Analytics, so click around to learn more about your mobile visitors! Remember to pay attention to the content report and the bounce rate of each page as this may help you identify pages that are not accessible to mobile devices.

An image of the Google Analytics interface showing the geographic overlay report - click to enlarge.

Learn more about Google Analytics and QR codes for marketing insight.
Your request has been submitted and a rep will reach out to you shortly.

Message Sent

Thank you for your interest.

Thank you for registering.

You should receive a confirmation email from GoToWebinar with your unique webinar login information. If you do not receive this email or have trouble logging in to the event, please email asmaa.mourad@cardinalpath.com.

Thank you for subscribing!

You're now looped into the world's largest GMP resource hub!

Thank you for your submission.

Thank you for your submission.

Thank you for your submission.

Thank you for your submission.

Thank you for your submission.

Message Sent

Thank you for registering.

Thank you for your submission.

Message Sent

Thank you for registering.

Thank you for registering.​

Paid media spend by Government websites increased a whopping 139% YoY in 2020.

2020 Online Behavior Live Dashboard

Message Sent

Thank you for registering.

Message Sent

Thank you for registering.

Message Sent

Thank you for registering.

2020 Online Behavior Live Dashboard

Thank you for your submission.

Message Sent

Thank you for registering.

Message Sent

Thank you for registering.

Message Sent

Thank you for registering.

Message Sent

Thank you for registering.

Message Sent

Thank you for your submission.

Message Sent

Thank you for registering.

Thank you for registering.

Cardinal Path is continuing with its series of free training. Next we are conducting training on Google Data Studio. Check it out here.
Cardinal Path hosted a live session to connect with you and answer all your questions on Google Analytics.
Get all the expertise and none of the consultancy fees in this not-to-be-missed, rapid-fire virtual event.

Thank you for submitting the form.

Thank you for submitting the form.

Message Sent

Thank you for registering.

Message Sent

Thank you for registering.

Message Sent

Thank you for registering.

Message Sent

Thank you for registering.

Message Sent

Thank you for registering.

Message Sent

Thank you for registering.

Message Sent

Thank you for registering.

Message Sent

Thank you for registering.

Message Sent

Thank you for registering.

Message Sent

Thank you.

Click here to download access the tool.

Message Sent

Thank you for registering.

Message Sent

Thank you.

Message Sent

Thank you.

Message Sent

Thank you

Message Sent

Thank you

Message Sent

Thank you.

Message Sent

Thank you

Message Sent

Thank you.

Message Sent

Success!
Your message was received.

Thank you.

Message Sent

Success! Thank you
for reaching out.