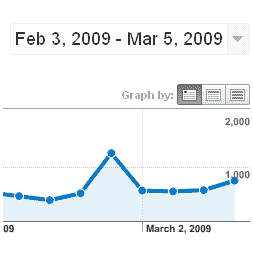
The other day the Google Analytics blog posted one of those simple GA features that always makes me slap my head and exlaim “how did I not know that!?” It ends up that GA has a “pivot” display mode that lets you juxtapose two sets of data. For instance, they recommend take keywords and pivoting by landing page. Not a bad suggestions… well, until you do it.
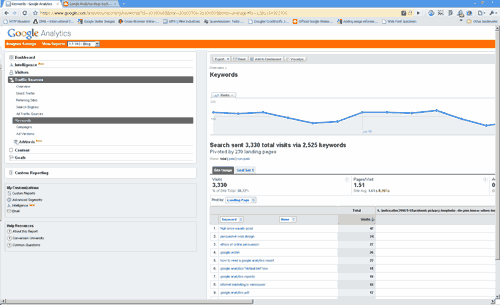
Ehh, right. Not the most usable report…

Of course, you could always do it the other way around. View by top landing pages, then by keyword. The sorting isn't as nice, but at least the reporting interface doesnt get elongated.
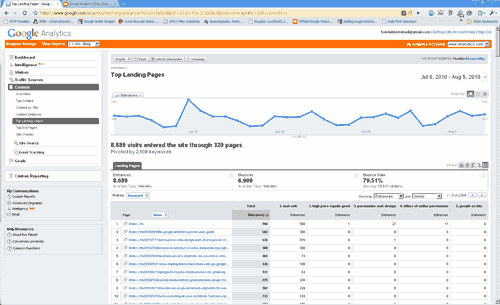
That's better. Now lets make it even-more-better. You can also show multiple data sets together, so you can have entrances and bounces (or bounce rate) at once, which provides some cool information. Plus we'll toss in a filter that only shows pages with more than one enterance (sadly I can't cut out all the “this keyword brought in zero traffic for this page” data due to tabular reasons). Finally, I'll only display keywords with a bounce rate greater than the site average.
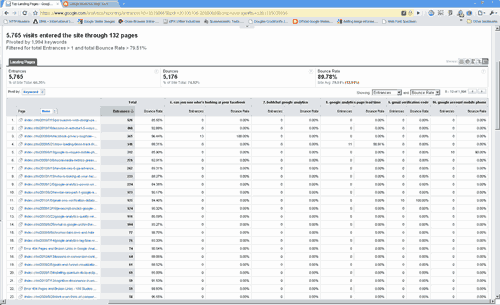
And there you have what keywords are bringing in a lot of traffic, and which are then bouncing. This is useful when considering what keywords you're using to drive traffic.

Now that we know this, there have to be more, even better, ways to use this feature. For instance, you could create a custom report, add avg. time on page into the mix. Do you see a particular keyword driving a lot of traffic that spends a lot of time on page, but has a high bounce rate? Then they're likely not seeing any more posts on similar topics and leaving. Maybe you should write more about that? (usual disclaimer about ATOP and its potential to be a bad metric on blogs, of course… even if Brian disagrees) 

Also, if you create a custom report, add a bunch of metrics, then pivot by another dimension, displaying only one of the metrics selected. Because the non-displayed metrics are included in the report, you can still filter by them, so you can look at, say, two pivoted data sets filtered by a metric. Granted you could do this with an advanced segment as well, but this requires less setup and allows you to change it on the fly.

Message Sent

Thank you for registering.

Cardinal Path hosted a live session to connect with you and answer all your questions on Google Analytics.
Get all the expertise and none of the consultancy fees in this not-to-be-missed, rapid-fire virtual event.

Thank you for submitting the form.

Thank you for submitting the form.

Message Sent

Thank you for registering.

Message Sent

Thank you for registering.

Message Sent

Thank you for registering.

Message Sent

Thank you for registering.

Message Sent

Thank you for registering.

Message Sent

Thank you for registering.

Message Sent

Thank you for registering.

Message Sent

Thank you for registering.

Message Sent

Thank you.

Click here to download access the tool.

Message Sent

Thank you for registering.

Message Sent

Thank you.

Message Sent

Thank you.

Message Sent

Thank you

Message Sent

Thank you

Message Sent

Thank you.

Message Sent

Thank you

Message Sent

Thank you.

Message Sent

Success!
Your message was received.

Thank you.

Thank you for registering.

Cardinal Path is continuing with its series of free training. Next we are conducting training on Google Data Studio. Check it out here.

Message Sent

Thank you for registering.

Thank you for your submission.

Your request has been submitted and a rep will reach out to you shortly.

Message Sent

Thank you for your interest.

Thank you for registering.

You should receive a confirmation email from GoToWebinar with your unique webinar login information. If you do not receive this email or have trouble logging in to the event, please email asmaa.mourad@cardinalpath.com.

Thank you for subscribing!

You're now looped into the world's largest GMP resource hub!

Thank you for your submission.

Thank you for your submission.

Thank you for your submission.

Thank you for your submission.

Message Sent

Thank you for registering.

Message Sent

Thank you for your submission.

Thank you for your submission.

Message Sent

Thank you for registering.

Thank you for registering.​

Paid media spend by Government websites increased a whopping 139% YoY in 2020.

2020 Online Behavior Live Dashboard

Message Sent

Thank you for registering.

Message Sent

Thank you for registering.

Message Sent

Thank you for registering.

2020 Online Behavior Live Dashboard

Thank you for your submission.

Message Sent

Thank you for registering.

Message Sent

Thank you for registering.

Message Sent

Thank you for registering.

Message Sent

Thank you for registering.

Message Sent

Success! Thank you
for reaching out.