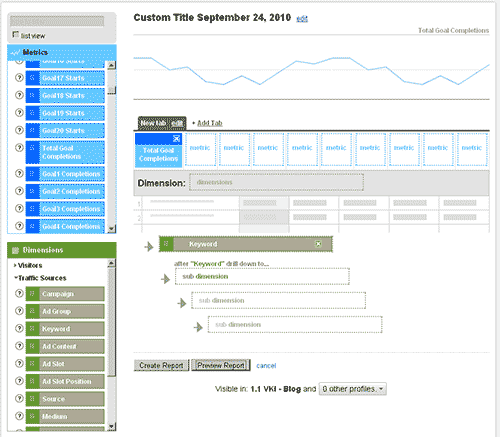
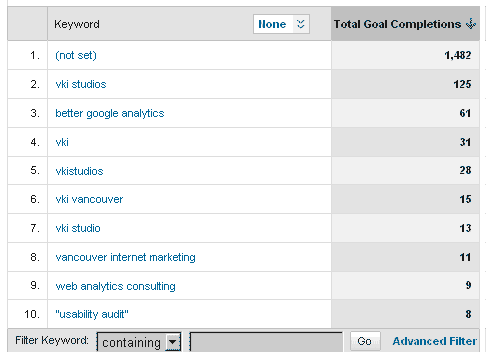
Last week we talked about using Google Analytics to do some early keyword research. This week, we’re going to look at how to understand the performance of keywords.

Understanding which keywords generate high and low profit margins will allow you to set keyword Cost-Per-Click levels and help to you understand where to distribute your budget. This kind of information can be essential to getting your campaigns off on the right track and help profitability from the start of the project. Knowing the keywords that have high profit margins will help you establish your priorities when constructing your campaigns.

Keyword Performance

Review product/service performance

  • Identify high traffic products/services
  • Identify top selling products /services by volume and revenue
    • Gain insights into budget distribution across campaigns and bids
    • Gain insights into keyword priorities

1. For E-commerce websites


Export data to a spreadsheet for additional analysis

Use second dimension to get more insights

2. For Non-Ecommerce websites


TIP

Use Pivot View in report to get more detailed information. Scroll to view hidden columns.

Come back next week and when will we look at measuring content performance.

Your request has been submitted and a rep will reach out to you shortly.

Message Sent

Thank you for your interest.

Thank you for registering.

You should receive a confirmation email from GoToWebinar with your unique webinar login information. If you do not receive this email or have trouble logging in to the event, please email asmaa.mourad@cardinalpath.com.

Thank you for subscribing!

You're now looped into the world's largest GMP resource hub!

Thank you for your submission.

Thank you for your submission.

Thank you for your submission.

Thank you for your submission.

Thank you for your submission.

Message Sent

Thank you for registering.

Thank you for your submission.

Message Sent

Thank you for registering.

Thank you for registering.​

Paid media spend by Government websites increased a whopping 139% YoY in 2020.

2020 Online Behavior Live Dashboard

Message Sent

Thank you for registering.

Message Sent

Thank you for registering.

Message Sent

Thank you for registering.

2020 Online Behavior Live Dashboard

Thank you for your submission.

Message Sent

Thank you for registering.

Message Sent

Thank you for registering.

Message Sent

Thank you for registering.

Message Sent

Thank you for registering.

Message Sent

Thank you for your submission.

Message Sent

Thank you for registering.

Thank you for registering.

Cardinal Path is continuing with its series of free training. Next we are conducting training on Google Data Studio. Check it out here.
Cardinal Path hosted a live session to connect with you and answer all your questions on Google Analytics.
Get all the expertise and none of the consultancy fees in this not-to-be-missed, rapid-fire virtual event.

Thank you for submitting the form.

Thank you for submitting the form.

Message Sent

Thank you for registering.

Message Sent

Thank you for registering.

Message Sent

Thank you for registering.

Message Sent

Thank you for registering.

Message Sent

Thank you for registering.

Message Sent

Thank you for registering.

Message Sent

Thank you for registering.

Message Sent

Thank you for registering.

Message Sent

Thank you for registering.

Message Sent

Thank you.

Click here to download access the tool.

Message Sent

Thank you for registering.

Message Sent

Thank you.

Message Sent

Thank you.

Message Sent

Thank you

Message Sent

Thank you

Message Sent

Thank you.

Message Sent

Thank you

Message Sent

Thank you.

Message Sent

Success!
Your message was received.

Thank you.

Message Sent

Success! Thank you
for reaching out.