Your users don’t want to wait
Did you know that Google Analytics can track how long it takes your web pages to load?
Slow loading web pages frustrate users and provide a poor user experience. There are a bunch of different tools to help you measure the size of your web pages in kb but what you really want to know is on average how long it takes you user to load each of your pages (measured in milliseconds). Beyond that you want to know how the visitor’s connection speed is influencing page load times.
To get Google Analytics to track page load times you will need to set up ‘Event Tracking’. Currently, to enable this feature you need to submit a request to Google from the event tracking documentation page.
Update: We’ve included the newest scripts here:
timeTracker.js
pageLoadTracker.js
The following code is based on the TimeTracker object written by Google. The original source code can be found here. We’ve updated the original source code to use the most current API calls (the original uses deprecated functions).
There are two objects used: TimeTracker which is the generic time tracking class (it can be used to time anything) and is also responsible for sending out the event tracking request to Google; and PageLoadTracker which is a wrapper for the TimeTracker class, and is specifically used to track page load times.
There are two snippets of code that need to be added to the page. The initialization code which should go as close to the opening tag as possible, and the window load event listener code which should go as close to the closing tag as possible.
Initialization Code
]]>
The PageLoadTracker constructor takes one required argument, and two optional arguments.
The first argument is the variable name of the Google Analytics page tracker object.
The second argument is the name of the index page. If you pass in ‘index.html’ as the second argument, visiting ‘www.example.com’ and ‘www.example.com/index.html’ will both show up as ‘index.html’ in the GA reports. This also works for subdirectories. So visiting ‘www.example.com/dir/’ and ‘www.example.com/dir/index.html’ will both show up as ‘/dir/index.html’ in the GA reports.
The third argument is used to specify a start time. Without the third argument, timing is started when the PageLoadTracker object is created. If you want to track the load time including the time required to load the TimeTracker and PageLoadTracker Javascript files as well, you need to record the timestamp before including the scripts, and pass that timestamp in as the third argument to the constructor.
Event Listener Code
]]>
This code adds an event listener that fires after the page and external files (images, javascript, css, etc) have been downloaded and displayed by the browser. Once the event is fired, the pageLoadTracker sends the event tracking request to the Google servers.
CAUTION! Because you are using events in this way you will corrupt your bounce rate metric. Because the TimeTracker event is being fired on every page Google Analytics thinks that the user has taken an action on every page and therefore hasn’t bounced (you will still have some people bouncing as they actually are real bounces who bounced prior to the entire page loading, but this number will likely be much smaller than your actual bounce rate). The way around this is to populate 2 separate Google Analytics accounts by double page tagging. This way you will have one account in which the TimeTracking event is fired and one in which the time tracking event isn’t. The account that is collecting the TimeTracking information will not have an accurate bounce rate while the other account will maintain an accurate bounce rate metric.
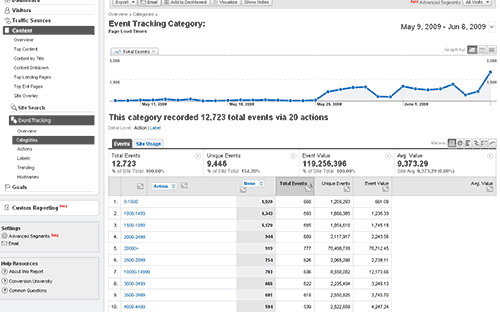
Another consideration when setting up the TimeTracking is how you will breakdown or categorize the different time intervals. In most cases we feel that the following millisecond break down is appropriate:
0-999
1000-1499
1500-1999
2000-2499
2500-2999
3000-3499
3500-3999
4000-4499
4500-4999
5000-5499
5500-5999
6000-6499
6500-6999
7000-7499
7500-7999
8000-8999
9000-9999
10,000-14999
15000-19999
20000+
Something else you will likely want to do is create a few advanced segments based on visitor connection speed (cable, DSL, T1, Dialup, ISDN, Unknown). I usually create one segment titled broadband and include Cable, DSL, T1 and a second which is Dialup and a third which is ISDN. By creating these advanced segments you will be better able to understand if slow loading times are as a result of the visitors connection speed, or if they are a result of heavy pages, server issues…
Edit:
As requested in the comments here is the page load time tracking within the Event Tracking reporting:


