Data visualization is an addictive substance, and Tableau is one of the most potent delivery mechanisms out there. We have clients with multimillion-dollar-a-month ad spends who won’t go into their marketing meetings without their Tableau reports. It’s a tool that lends itself to accountability and for actioning data at speed by letting users safely and quickly visualize, manipulate and explore giant data sets. But it’s also at the forefront of a big movement in the way people are now able to use data in their jobs.
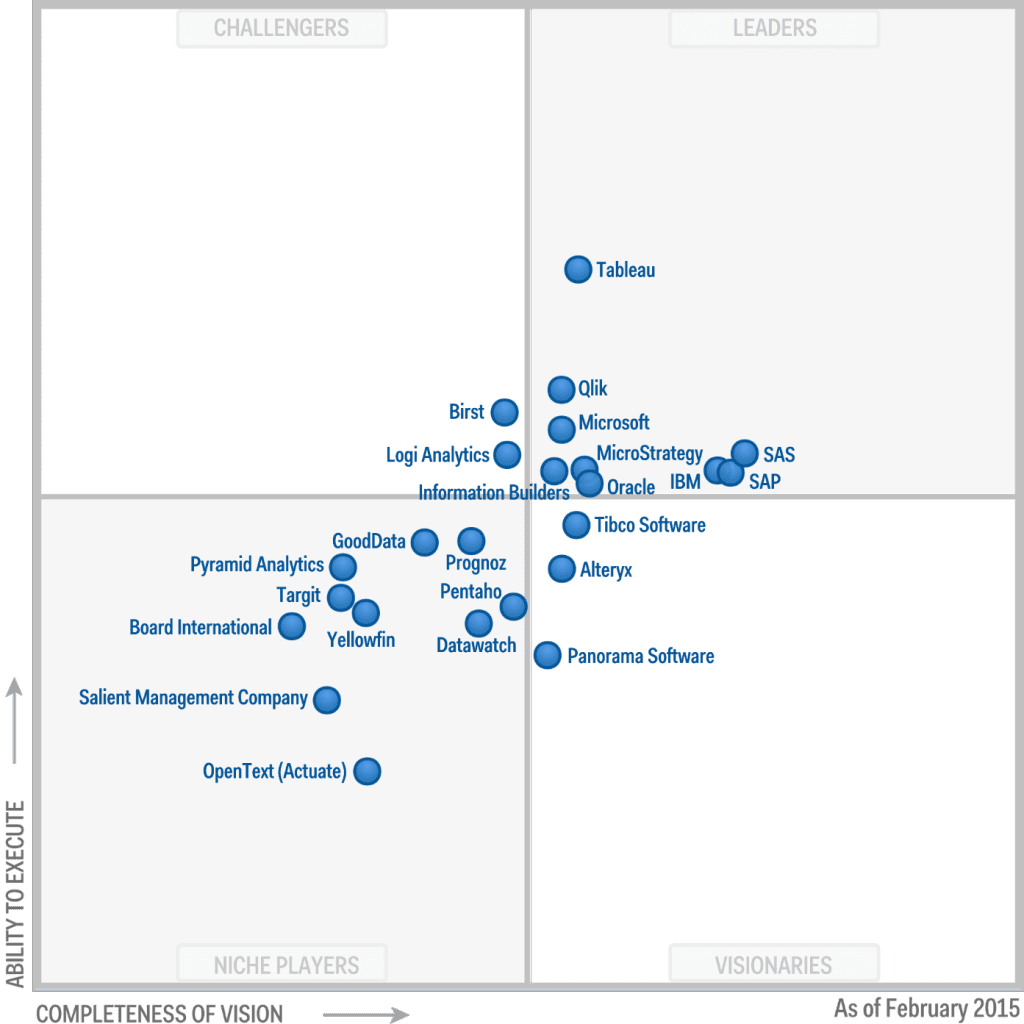
So it’s no surprise that the recent Gartner Magic Quadrant for Business Intelligence and Analytics Platforms, which positions Tableau as the clear forerunner solution atop the Leaders quadrant ahead of such well-known players as SAS, IBM, Oracle and Microsoft, underscores this shift with evidence that the BI and analytics platform market is moving away from merely pushing out information in old, static formats to various stakeholders and towards exploration, enabling true data discovery. The report states that: “more than half of net new purchasing is data-discovery-driven” and that the shift to a decentralized model which empowers business users also reinforces the need for governance. With its relative ease of use and data safety mechanisms, Tableau bridges the gap between marketing and IT departments in a fundamental nod to the importance of an organization’s data – and its accessibility and usefulness throughout the organization.

Tableau has not only responded to, but pioneered, the raising of the profile of data in an organization from an underused asset that sits in basements to a powerful and intuitive tool that can very simply facilitate priceless insights.
“Accessing and understanding data doesn’t need to be a specialized skill anymore. With trusted data and proper governance in place, there’s no reason why people shouldn’t be empowered to access, explore and be guided by data to do their job. Tableau gives people the tools to do just that,”
–Ajay Chandramouly, Director of Analyst Relations.
Paramount to Tableau’s success is its ability to put the power of big queries into the hands of business professionals with great understanding of their role in an organization – but little programming or data science experience – low-cost and low-risk, but potential for huge gains.
One of the challenges with getting data to actually mean something to business stakeholders has been that few possess the requisite IT or data science skills to make much use of large, complex data sets. Accessing information that can guide decision-making has been difficult and tools like Tableau are changing all that by providing stakeholders with a clean and intuitive interface to view, query, and play with data in ways that surface the right information to the right person at just the right time to make the right decision.


