There’s a major algorithm update rolling out the week of April 21, 2015 that will affect how sites appear in mobile search results.
News of the update has crossed-over from the SEO industry and into IT teams, marketing, and boardrooms around the world, and for good reason. Google’s approach to the update – providing tools and reports and giving site owners time to take stock and implement changes – is an indication that the effects will be tremendous. So what exactly is going to happen and how it will affect not only websites, but also a company’s bottom line? To answer these questions, let’s take a look at what the algorithm change is, why it should matter to you and what tools and reports can help identify how it will affect your site.
What is the mobile-friendly algorithm update about?
In late February of this year, Google took the unusual step of announcing that their mobile algorithms would soon be expanded. Beginning April 21, 2015, mobile friendly web pages will be given a higher priority in search results:
Starting April 21, we will be expanding our use of mobile-friendliness as a ranking signal. This change will affect mobile searches in all languages worldwide and will have a significant impact in our search results. Consequently, users will find it easier to get relevant, high quality search results that are optimized for their devices.
The search engine’s goal is to provide the best search result to a user no matter what platform they are utilizing – the desktop, an app or a mobile device. In the case of a search from a mobile device, Google’s updated algorithms will ensure that the mobile user gets results that are tailored for their device – pages / sites that are designed for the mobile user. Instead of getting a mix of results from sites that are traditional desktop sites, the search engine will return mobile results first.
Why it matters
While Google was thought to have some level of mobile-friendliness in its algorithms, the upcoming expansion means that organizations with desktop-only pages will see organic mobile visits decrease. And for those that have established a mobile-friendly website? Well, it’s a start, but Google may still discover mobile usability issues. If you haven’t worked through all of your errors, this update is still going to affect you.
For many businesses, having a mobile site has been on the radar but in many cases, it hasn’t been an organizational priority. The sites may have been planned, but not deployed. As organic traffic levels likely never fluctuated over the years, there was no need to change the status quo, especially with IT and marketing departments focusing on improving their websites in other areas. But there have been many signs and Google has been making noises about mobile for some time now. At the 2014 SMX West, Google’s head of webspam, Matt Cutts, left the conference with three words: “… prepare for mobile.”
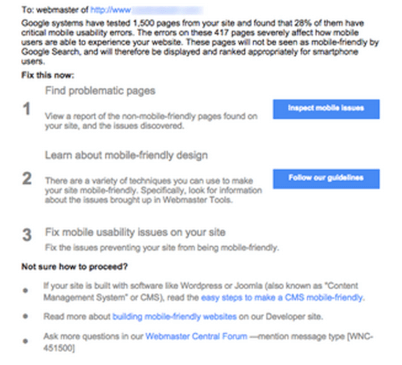
In recent months Google amplified the message by deploying new functionality in Google Webmaster Tools in the form of a mobile usability report. The search engine began alerting webmasters about pages that had mobile usability errors.
Understanding the impact
Businesses that want to know how this update will affect them should look to their current data. It will be important to gauge how much mobile traffic from Google your site currently receives and what pages and terms you are currently visible for. Companies that have mobile pages will also want to review the health of their sites. The update is at the page level so any pages that may have usability issues could be at risk. Fortunately, Google Analytics and reports in Google Webmaster Tools can provide you with much of the information needed.
Starting with Google Webmaster Tools, there are several reports that you will want to review. You can learn which pages are not mobile friendly, what keywords are being used, and what pages are showing in a Google search results page. You can use these reports to start benchmarking your current site. Remember, Google only shares 90 days of data so download your reports on a regular basis!
Mobile Usability Report
Google believes that users on a mobile device should expect to click on a search result and be taken to a page that provides a positive user experience. For mobile usability, the following elements are most often flagged by Google:
- Viewport Configuration – A tag that can tell the browser what size to render the content for each platform
- Defining the viewport – Content on the page may be too wide for the defined viewport or the viewport has been improperly set with a fixed size.
- Font size – fonts that are too small for mobile users to tap
- Tap / Touch Elements – Links, buttons and navigational items are often the culprits. The mobile user needs to be able to tap or touch the element without having to “pinch and enlarge” the screen
- Non mobile-friendly technologies – Flash content, or other content that mobile browsers can’t render
The mobile usability report is found in Search Traffic / Mobile Usability
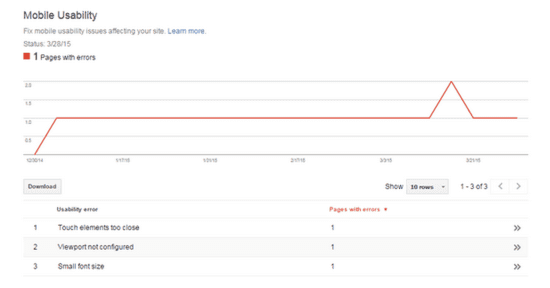
Each report shows how many pages have mobile usability errors. You can drill down to discover what pages Google has flagged as having issues. Take note of how many pages the search engine is discovering usability errors upon, learn from these insights, and take action .
Since the update is at the page level and runs in real time, once you repair the errors and Google discovers the updated page, the usability errors will decrease and the page will be treated as mobile-friendly. Like the example above, it may be just a few pages, but for many sites it is likely hundreds, if not thousands, of pages with errors.
Search Queries
Google Webmaster Tools offers insights into what terms your customers and prospects are searching for in Google and through which platform. The Search Queries reports offers additional data with powerful filters that focus on platform (web, mobile, video, images), view results by location and even filter by search terms. The search queries report is found in Search Traffic / Search Queries.
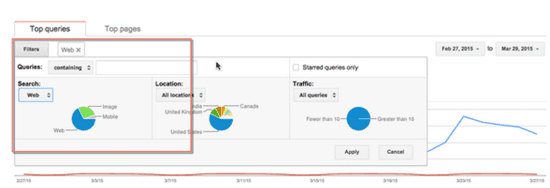
When you first load the report, you will see results for the web (desktop) user. You will want to use the filters button to change this to mobile. Here you will discover the search terms, or keywords, that mobile users have used to surface your site in a Google search result.
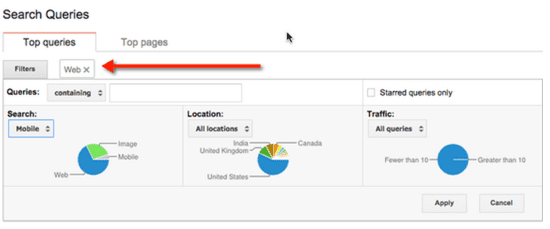
The mobile queries report will give you the amount of impressions (number of times your site appears in a Google search result for the keyword), clicks (number of times the user clicks on the search result to your site), the click through rate and the average position (ranking) of the term.
You can download this data and use as a benchmark. Google Webmaster Tools allows you to change the date so you can download by month or by whatever dates you require. Keep in mind that you only have 90 days’ worth of data to examine.
The search queries report also allows you to refine your filter by location, or by specific keywords. Depending on the needs of your business, this could be useful data to benchmark.
Top Pages
The top pages report displays what pages on your site have surfaced in a Google search. The top pages report is similar to the Queries report – you can use filters to focus on specific platforms and locations. The report can be found in Search Traffic / Search Queries / Top Pages.
The mobile top pages report gives you insight into what pages are being discovered by searchers on a mobile device. These are the pages that will be impacted by the mobile friendly algorithm update.
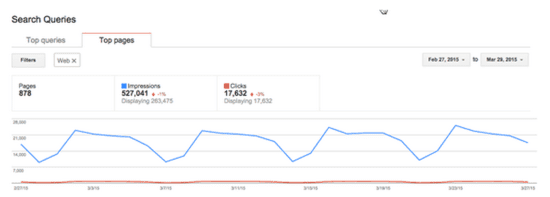
Looking at the report, the metrics show how many times the page has displayed in a search (impressions), how many times a searcher has clicked through (clicks), the click through rate and like search queries – the average position or rank of the page.
Like the Queries report, you’ll want to use the filters button to switch the default Web setting to Mobile. Here you will be able to view the pages that most often display in mobile search result pages. If you are not certain that the pages are mobile friendly, you can use the mobile usability report to check or use Google’s Mobile Friendly Testing Tool.
If you have Google Analytics integrated with Google Webmaster Tools, the Search Queries and Landing page reports also allow you to run similar reports. When viewing the report, select the secondary dimension Google Property. From here, you can use the advanced filter to display only mobile (smartphone) results.
Blocked Resources
Google recently added the Blocked Resources report to Google Webmaster Tools. This tool can help site owners discover content that is blocking Google’s bots from crawling your website.

How does this affect your mobile usability?
If Google’s bots cannot properly access your content, they will not know what platform it should associate the page with. Remember, Google wants to bring the best result to the user no matter what platform they are on. They want to display desktop content to the desktop searcher, mobile optimized pages to the mobile searcher and in-app content for an App user. If their crawlers can’t access the page, then they can’t make this determination and it may lower your site’s ability to rank well.
Review the report to see what content is being blocked. Take action by removing any barriers for the crawlers – and do not block JavaScript, Images or Stylesheets.
Measuring Mobile Search Traffic from Google
Understanding what pages and what search queries may be impacted are important and Google Webmaster Tools is a fantastic resource for that. Comparing your desktop data to your mobile can also provide insights into behavior and interests. When you want to go deeper, and understand the impact on your site and your bottom line, you can look to analytics tools such as Google Analytics.
Mobile Google Organic Search
Google Analytics provides you with mobile specific reports such as the Audience/ Mobile reports. Here you can view your mobile trends, understand what devices are being used by your mobile visitors. Out of the box, the report displays the effect that each platform – desktop, mobile or tablet – has on your site’s traffic, goals and conversions and allows you to answer questions such as:
- How much traffic do I get from mobile compared with tablets or desktops?
- How engaged are mobile users?
- What impact on revenue or conversions do mobile visitors have?
To understand how mobile traffic from organic sources affect your site’s activity, you can also drill down and add secondary dimensions to the reports.
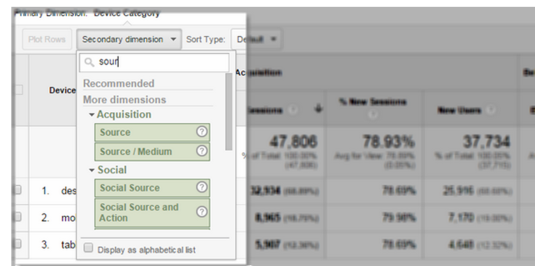
Select Source / Medium then filter for “Organic / Google” to view your organic search traffic from Google for each platform.
Using the secondary dimension, you can now answer questions like:
- How much mobile traffic from Google am I receiving?
- Does this traffic convert or contribute to revenue? What is the percentage compared to desktop or tablet visitors?
- How engaged are mobile visitors from Google compared to other platforms?
Use a Custom Segment
If you want to compare, you can create a custom segment to identify
Google mobile organic visitors.
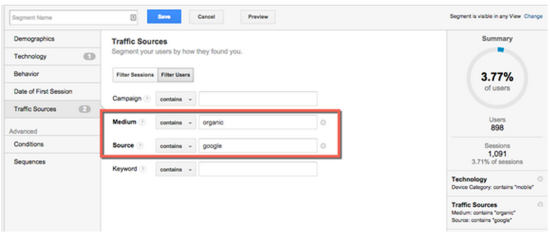
- Create a new, custom segment. Select mobile as your device category.

- Select your traffic sources. As we want to look at organic traffic from Google, we’ll select the appropriate medium and source.

With this custom segment you can focus on your Google mobile organic user behavior – view the mobile user’s top landing pages, track the top events, and understand the impact on revenue and/or conversions. In the example above, we can instantly see that the segment represents 3.77% of all users. We can save the segment and apply it to most views in Google Analytics.
If you do not have a mobile friendly site, you can get a better view of what role mobile search traffic from Google plays on your site. And if you do? You can use the search reports to better understand your mobile visitor, build on the data and use it to optimize your content for their needs.
Moving Forward
Google has made it clear that sites serving a mobile audience need to take notice and address usability issues. To do this, you’ll not only need a clear understanding of what effect the Google mobile organic segment has on your site’s conversions and goals but also what terms and pages are currently visible to mobile searchers. The tools and reports Google has provided will help to identify, repair and measure mobile trends.
Mobile is an increasingly important part of a robust digital strategy, and this major update from Google is the push organizations need to pay attention to their mobile users as a matter of priority.
Resources:


