2020 Online Behavior Dashboard
Data, or specifically insights unlocked by analytics, is a critical resource for organizations in the ever-changing pandemic-era that we’re living in today. Clear, reliable reporting increases the ability to respond to urgent questions, proactively prepare efficient solutions, and bring data and clarity into the decision-making process.
Access the 2020 Online Behavior Dashboard and understand the effects of major events on the year-over-year trends of website traffic and user engagement across 16 industries and see how your organization stacks up
Access the 2020 Online Behavior Dashboard and understand the effects of major events on the year-over-year trends of website traffic and user engagement across 16 industries and see how your organization stacks up
Dashboard Features:
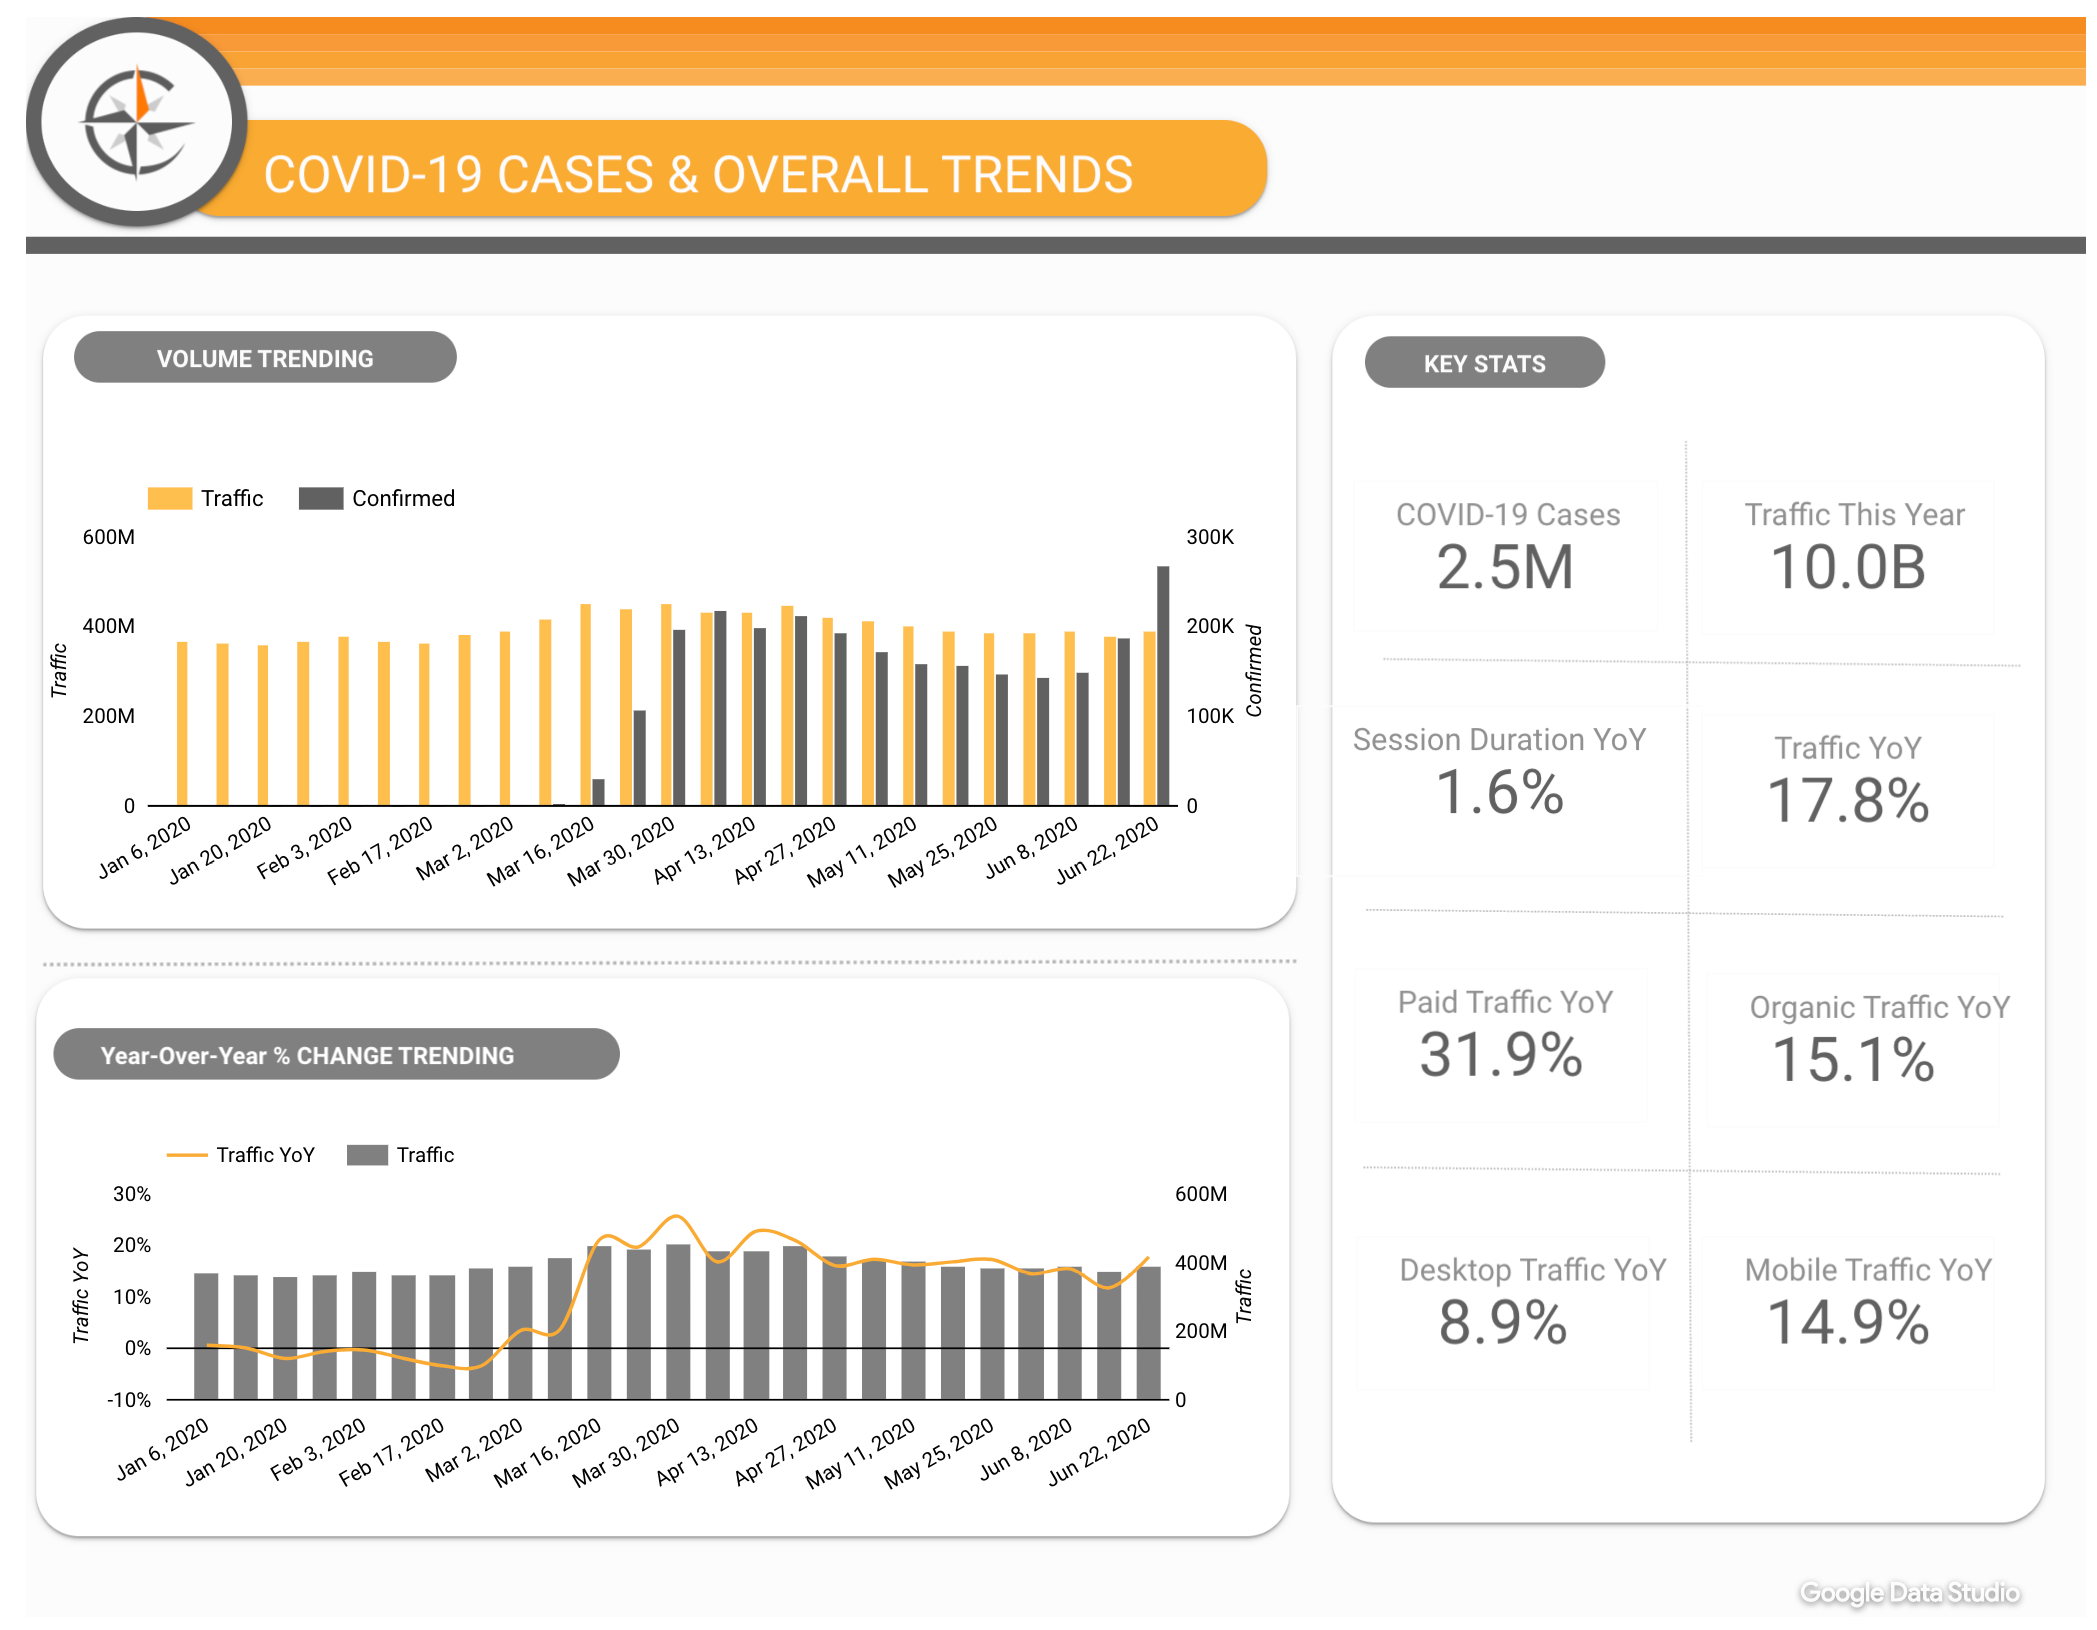
Explore and visualize the impact of COVID-19 cases on User Engagement
Explore, uncover anomalies, and find out where your organization stacks up against these major brands.
Analyze vertical-level insights of YoY traffic volume
Understand how actual traffic volumes have been impacted by major events of the year to compare with what you’re vertical is experiencing and attempt to forecast trends.
Compare top-performing vs. lagging verticals
Visualize and unlock insights across 16 industries broken down by geography, channel, and device.

You may also be interested in:

About Cardinal Path
Cardinal Path is a data-first consultancy, delivering transparent, data-driven insights to help marketers harness the power of their first-party data while accelerating digital maturity. Learn More
Our Clients


Our Partners


